

Relationship between genetic variation in the glutaminase gene GLS1 and brain glutamine/glutamate ratio measured in vivo
- PMID: 21457947
- PMCID: PMC3125415
- DOI: 10.1016/j.biopsych.2011.01.033
Relationship between genetic variation in the glutaminase gene GLS1 and brain glutamine/glutamate ratio measured in vivo
Abstract
Background: Abnormalities in glutamatergic neurotransmission are implicated in several psychiatric disorders, but in vivo neurochemical studies of the glutamate (Glu) system have been hampered by a lack of adequate probes. By contrast, glutamine (Gln) and Glu can be quantified separately in proton magnetic resonance spectroscopy studies in vivo. Accumulating evidence suggests that the Gln/Glu ratio is a putative index of glutamatergic neurotransmission but interpretation of changes in the Gln/Glu ratio depends on the conditions of the system, including ammonia levels.
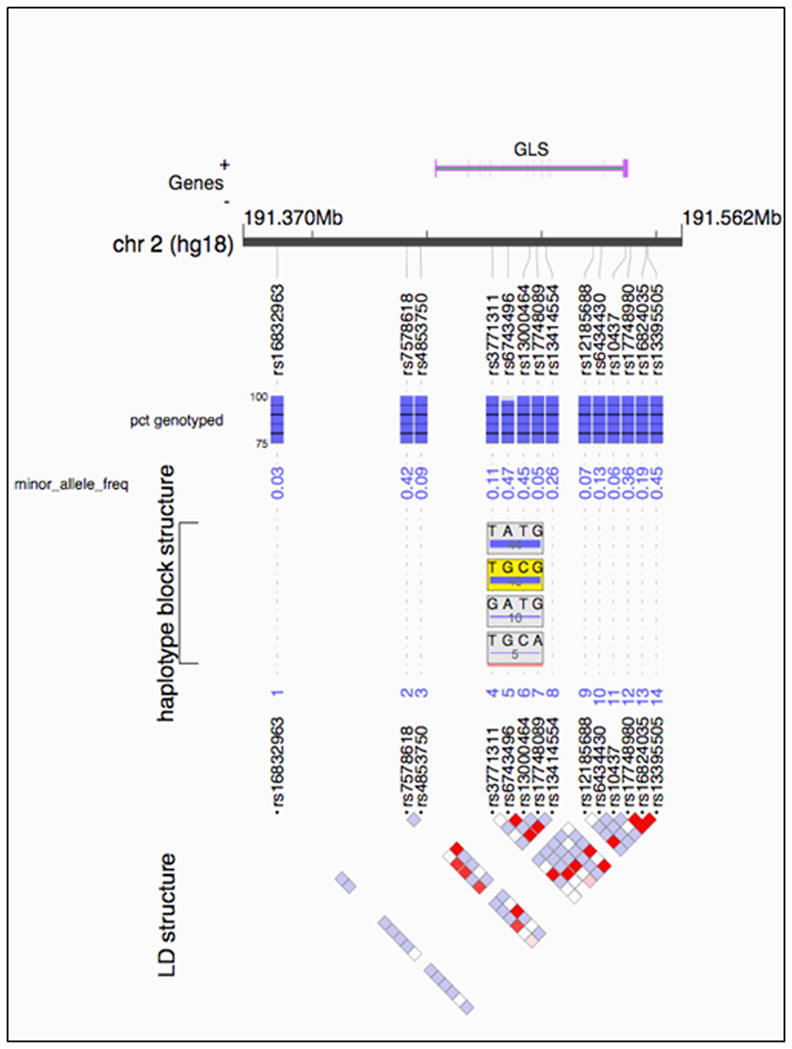
Methods: Here, we explored whether variation in GLS1 (the gene encoding the brain isoform of glutaminase, which catalyzes Gln-to-Glu conversion) is associated with Gln/Glu measured in vivo in two brain regions (anterior cingulate cortex, parieto-occipital cortex).
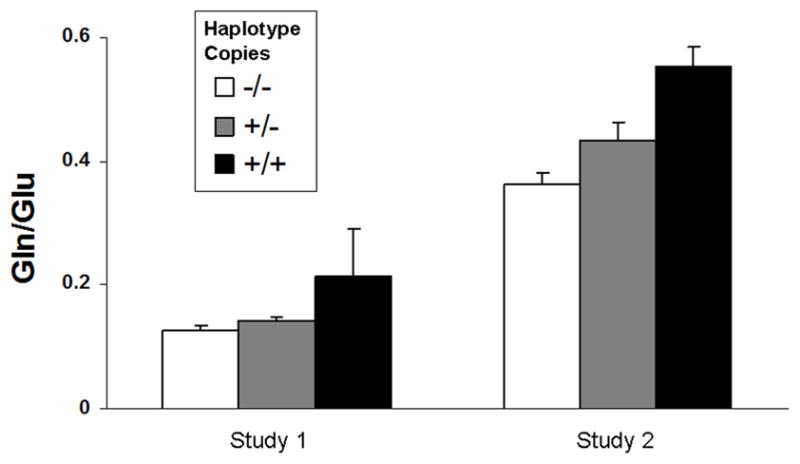
Results: A specific haplotype of four single nucleotide polymorphisms within GLS1 was significantly associated with Gln/Glu in the parieto-occipital cortex in an magnetic resonance spectroscopy-genetics dataset optimized for Gln/Glu detection (n = 42). This finding was replicated in a second magnetic resonance spectroscopy dataset that was optimized for γ-aminobutyric acid detection where Gln and Glu measurements could still be extracted (n = 40).
Conclusions: These findings suggest that genetic variation in a key component of glutamatergic machinery is associated with a putative in vivo index of glutamatergic neurotransmission. Thus, GLS1 genotype might provide insight into normal brain function and into the pathophysiology of many psychiatric conditions where glutamatergic neurotransmission has been implicated. It might also serve as a biomarker for predicting response to existing and novel therapeutic interventions in psychiatry that target glutamatergic neurotransmission.
Copyright © 2011 Society of Biological Psychiatry. Published by Elsevier Inc. All rights reserved.
Conflict of interest statement
Figures
References
-
- Schousboe A, Waagepetersen HS. Role of astrocytes in glutamate homeostasis: implications for excitotoxicity. Neurotox Res. 2005;8(3–4):221–5. - PubMed
-
- Magistretti PJ, Pellerin L. The astrocyte-mediated coupling between synaptic activity and energy metabolism operates through volume transmission. Prog Brain Res. 2000;125:229–40. - PubMed
-
- Jensen JE, Licata SC, Ongur D, Friedman SD, Prescot AP, Henry ME, et al. Quantification of J-resolved proton spectra in two-dimensions with LCModel using GAMMA-simulated basis sets at 4 Tesla. NMR Biomed. 2009;22(7):762–9. - PubMed
-
- Posse S, Otazo R, Caprihan A, Bustillo J, Chen H, Henry PG, et al. Proton echo-planar spectroscopic imaging of J-coupled resonances in human brain at 3 and 4 Tesla. Magn Reson Med. 2007;58(2):236–44. - PubMed
-
- Schulte RF, Lange T, Beck J, Meier D, Boesiger P. Improved two-dimensional J-resolved spectroscopy. NMR Biomed. 2006;19(2):264–70. - PubMed
Publication types
MeSH terms
Substances
Grants and funding
LinkOut - more resources
Full Text Sources
Miscellaneous
