. 2011 Apr 12;21(7):527-38.
doi: 10.1016/j.cub.2011.02.040. Epub 2011 Mar 31.

Quantitative variation in autocrine signaling and pathway crosstalk in the Caenorhabditis vulval network

Affiliations

Quantitative variation in autocrine signaling and pathway crosstalk in the Caenorhabditis vulval network

Erika Hoyos et al. Curr Biol. .

Abstract

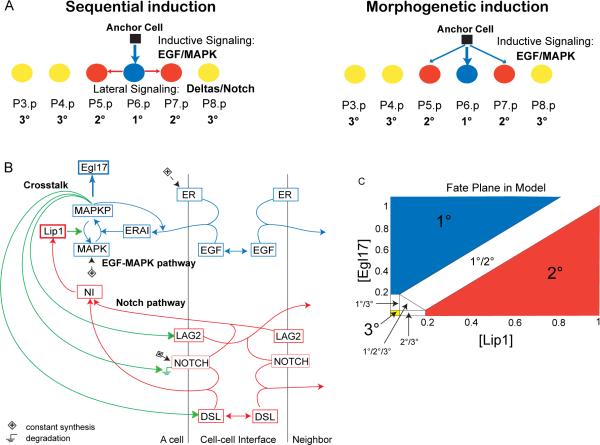
Background: Biological networks experience quantitative change in response to environmental and evolutionary variation. Computational modeling allows exploration of network parameter space corresponding to such variations. The intercellular signaling network underlying Caenorhabditis vulval development specifies three fates in a row of six precursor cells, yielding a quasi-invariant 3°3°2°1°2°3° cell fate pattern. Two seemingly conflicting verbal models of vulval precursor cell fate specification have been proposed: sequential induction by the EGF-MAP kinase and Notch pathways, or morphogen-based induction by the former.

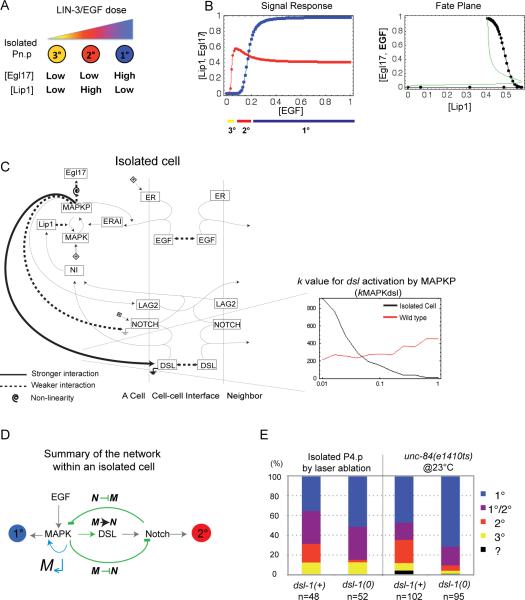
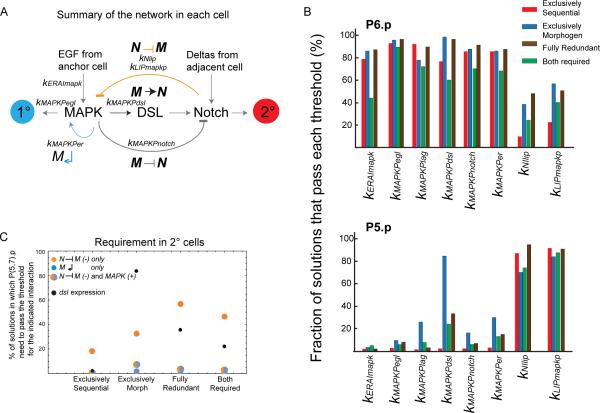
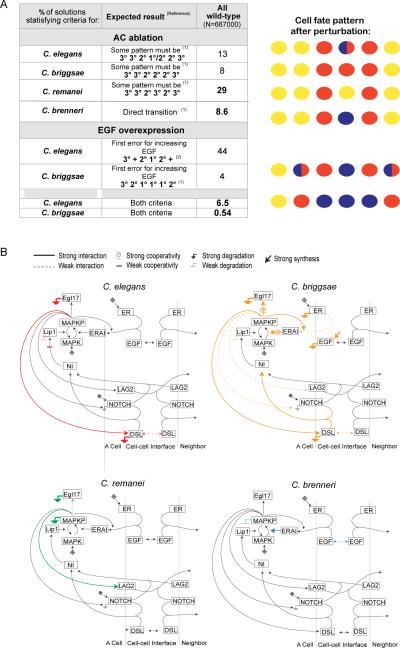
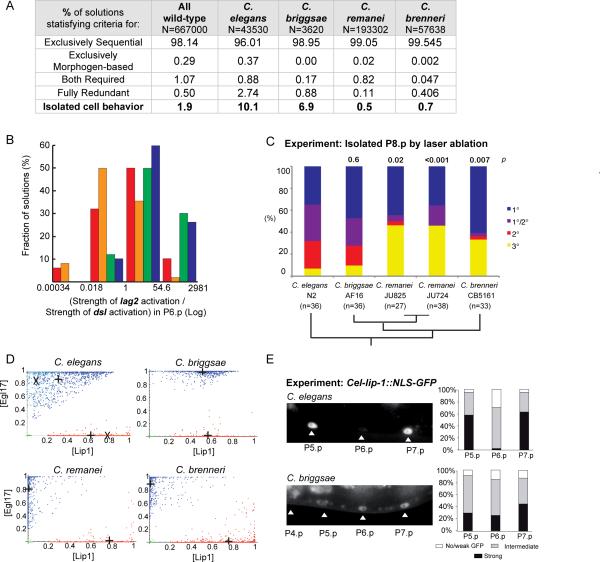
Results: To study the mechanistic and evolutionary system properties of this network, we combine experimental studies with computational modeling, using a model that keeps the network architecture constant but varies parameters. We first show that the Delta autocrine loop can play an essential role in 2° fate specification. With this autocrine loop, the same network topology can be quantitatively tuned to use in the six-cell-row morphogen-based or sequential patterning mechanisms, which may act singly, cooperatively, or redundantly. Moreover, different quantitative tunings of this same network can explain vulval patterning observed experimentally in C. elegans, C. briggsae, C. remanei, and C. brenneri. We experimentally validate model predictions, such as interspecific differences in isolated vulval precursor cell behavior and in spatial regulation of Notch activity.

Conclusions: Our study illustrates how quantitative variation in the same network comprises developmental patterning modes that were previously considered qualitatively distinct and also accounts for evolution among closely related species.


Figures

Figure 1
Figure 1. Vulval induction network in C. elegans
(A) Two verbal models of fate specification in the row of six vulval precursor cells in C. elegans: 1° (blue), 2° (red) and 3° (yellow) fates. (B) Schematic diagram summarizing interactions in the model between EGF (blue) and Notch (red) pathways, and their crosstalk (green). All cells have the same network wiring. Boxes are gene products. ER: EGFR, ERAI: activated EGFR or Ras pathway, MAPKP: phosphorylated MAP kinase, Egl17: 1° cell fate effector, DSL: diffusible Delta, LAG2: membrane-bound Delta, NOTCH: Notch receptor, NI: Notch intracellular domain, Lip1: 2° cell fate effector and MAP kinase phosphatase. The Ground symbols indicate degradation, and (+) constant synthesis. Simple arrows indicate transformation (MAPK to MAPKP and conversely), binding (ligands to receptors) or activation of the downstream node, according to equations in Supplemental Procedures. Double arrows indicate diffusion. (C) Fate plane in the model showing the criteria used to assign cell fates, according to concentrations of Lip1 and Egl17, which are 2° and 1° fate effectors, respectively. Cell fates at the boundaries correspond to (experimentally observed; [11]) intermediate fates. See also Figure S1 and Table S1.
Figure 2
Figure 2. Role of DSL-1 autocrine signaling in the response of an isolated cell to EGF
(A) Cartoon depicting the response of an isolated cell to EGF doses, based on experimental evidence, obtained either by varying their distance from the EGF source [14] or using a tunable promoter driving EGF synthesis [11]. (B) Signal response curve in an isolated simulated cell showing the concentrations at 300 min of Lip1 (red) and Egl17 (blue) for increasing EGF doses. The cell fate trajectory is shown below. (C) Network diagram indicating the strength of the interactions characteristic of solutions that can stabilize an isolated cell in any of the three cell fates, without intermediate fates (summarizing Table S4 and Fig S3). Thick solid lines indicate stronger interactions, and thin dotted lines weaker interactions compared to wild-type solutions, as defined by the parameter values for the corresponding step: a low k value is expressed as a strong interaction. A spiral indicates high cooperativity. An example of parameter distribution histogram is displayed on the bottom right, plotting the binned number of solutions where kMAPKdsl has the corresponding parameter value on the x axis. (D) Vulval induction network summary showing the feedback and crosstalk (green) of the MAPK and the Notch pathways within a cell. M↵: MAPK pathway positive feedback loop; MN: MAPK-mediated activation of DSL production; MN: MAPK-mediated inhibition of Notch; NM: Notch-mediated inhibition of MAPK. (E) Experimental proportions of fates adopted by an isolated cell in wild-type and dsl-1(0) worms in the C. elegans N2 background (Table S2). In the laser ablation, all competent Pn.p cells except P4.p were killed. In unc-84 mutant animals with defective Pn.p formation, only animals with a single Pn.p cell were scored. We separated the cases where the two daughters adopted 2° and 1° fates, respectively, as such 2° fates are not isolated from a 1° fate. The 2° fate proportion differs significantly between the dsl-1(+) and dsl-1(0) groups: p=0.006 in the laser ablation and p<0.001 in the unc-84 experiment See also Figure S2 and Table S2.
Figure 3
Figure 3. Sequential and morphogen-based inductions are found for different parameter sets of the model
(A) Tests for morphogen-based versus sequential induction in the model. The simplified intercellular network characteristic of each patterning mechanism is shown on the right, with the color code from Fig 1. (B) Robustness of the vulval induction network to parameter variation. Graph showing the fraction of solutions (y-axes) that produced a stable wild-type pattern after 10-fold variation in the specified parameter (x-axes) (n=300 solutions from each mode). High values (close to 1) indicate insensitivity to the 10-fold parameter change. (C) Network diagrams indicating the interaction strength characteristic of the patterning mode, as defined by parameter values for the corresponding step: for example, a low k value is expressed as a strong interaction. These networks summarize the results of the Kolmogorov-Smirnov test comparing parameter distributions of wild-type solutions against solutions from each mode (Table S4 and Fig S3A). Two parallel bars on an arrow indicate low cooperativity. (D) Schematic representation of model parameter space in two dimensions. The parameter sets that produce the wild-type pattern, each patterning mode, “C. elegans” (AC ablation and egf overexpression criteria only) and “C. elegans N2” are schematically represented as a fraction of space (other species sets are omitted for simplicity). See also Figure S3 and Tables S3, S4.
Figure 4
Figure 4. Variation in activation and requirement for different network components in the different patterning modes
(A) Vulval induction network scheme showing the interactions between MAPK and Notch pathways within a cell, with external input from adjacent cells in the six-cell row. (B) Percentage of solutions of each patterning mode for which a given event occurs in P6.p (upper panel) or P5.p (lower panel). An event is defined as occurring when a given protein concentration reaches the threshold for a specified interaction (kAb denotes the concentration in factor “A” where downstream factor “b” is half-activated, see Supplement). n=500 solutions from each mode. (C) Percentage of solutions belonging to each patterning mode in which P(5,7).p need to pass the indicated threshold to become 2°: Lip1 threshold to activate NM (yellow), MAPKP threshold to activate M↵ (blue), both of them (not necessarily at the same time) (yellow-blue dot), MAPKP threshold for dsl expression (black). See also Figure S4 and Table S5.
Figure 5
Figure 5. Localization of Caenorhabditis species in parameter space
(A) Anchor cell ablation and EGF overexpression criteria used to identify the species sets within the parameter space of all wild-type solutions, after experiments in [14] and Table S6. Numbers indicate the percentage of wild-type solutions that produce the expected pattern. + signs indicate any fate different from 3°, whereas 1°/2° indicates the intermediate fate shown in Fig 1C. A schematic drawing of cell fates after perturbation is shown on the right (color code as in Fig 1). (B) Network diagrams indicating the strength of the interactions characteristic of Caenorhabditis species. These networks summarize the Kolmogorov-Smirnov tests comparing parameter distributions of each species set against wild-type solutions (Table S7A, Fig S5). See Figure 1 legend and the legend above the figure panel for explanations. See also Figure S5 and Tables S6–S7.
Figure 6
Figure 6. Prediction and experimental confirmation of interspecific variation in the propensity for isolated 2° fates (A–C) and in Notch pathway activation in P6.p (D–E)
(A) Percentage of solutions of each species set that belong to each of the four patterning modes. Caenorhabditis species solutions differed in their capacity to stabilize an isolated 2° cell at intermediate EGF doses (p<0.001, d.f.=3, G test of independence after Williams correction=11726.1). (B) Histograms showing the distributions of the ratio between the strength (flux value) of lag2 activation over the strength of dsl activation by MAPKP in P6.p (n=500 solutions from each species). The median value is 0.5 for C. briggsae (orange), 1.7 for C. elegans (red), 12.5 for C. brenneri (blue) and 27.0 for C. remanei (green). (C) Experimental proportions of fates adopted by an isolated P8.p cell in different species. p s of isolated 2° cells compared to C. elegans are noted above the bars. Phylogenetic relationships [27] are indicated below. (D) Fate plane distributions of P6.p (blue) and P5.p (red) in the Caenorhabditis species solutions (n=1000 solutions for each). Crosses indicate the average cell position. In the C. elegans graph, the paler dots and “X” correspond to “C. elegans N2”. (E) Experimental test of the prediction in (D). On the left, representative fluorescence micrographs show Cel-lip-1∷GFP expression in Pn.p nuclei in C. briggsae AF16 (mfIs29 transgene) and C. elegans N2 (zhIs4 transgene) backgrounds. The same pattern was observed with an independent C. briggsae transgenic line (mfIs30 transgene, obtained from another injected animal). Histograms on the right show semi-quantitative measurements of Cel-lip-1 reporters. Data for C. elegans are from [10], placed on a semi-quantitative scale for comparison with C. briggsae. Differences between P(5–7).p are not (or marginally) significant in C. briggsae, but highly significant in C. elegans. χ2 tests: p=0.054 in C. briggsae (n=78), p=3.10−8 in C. elegans (n=40). See also Figure S6 and Table S8.

References

    1. Wagner A. Robustness and evolvability in living systems. Princeton University Press; Princeton and Oxford: 2005.
    1. Barkai N, Leibler S. Robustness in simple biochemical networks. Nature. 1997;387:913–917. - PubMed
    1. Alon U, Surette MG, Barkai N, Leibler S. Robustness in bacterial chemotaxis. Nature. 1999;397:168–171. - PubMed
    1. von Dassow G, Meir E, Munro EM, Odell GM. The segment polarity network is a robust developmental module. Nature. 2000;406:188–192. - PubMed
    1. Meir E, von Dassow G, Munro E, Odell GM. Robustness, flexibility, and the role of lateral inhibition in the neurogenic network. Curr. Biol. 2002;12:778–786. - PubMed

Publication types

MeSH terms

Substances