

Lipidomics of human Meibomian gland secretions: Chemistry, biophysics, and physiological role of Meibomian lipids
- PMID: 21458488
- PMCID: PMC3114158
- DOI: 10.1016/j.plipres.2011.03.003
Lipidomics of human Meibomian gland secretions: Chemistry, biophysics, and physiological role of Meibomian lipids
Abstract
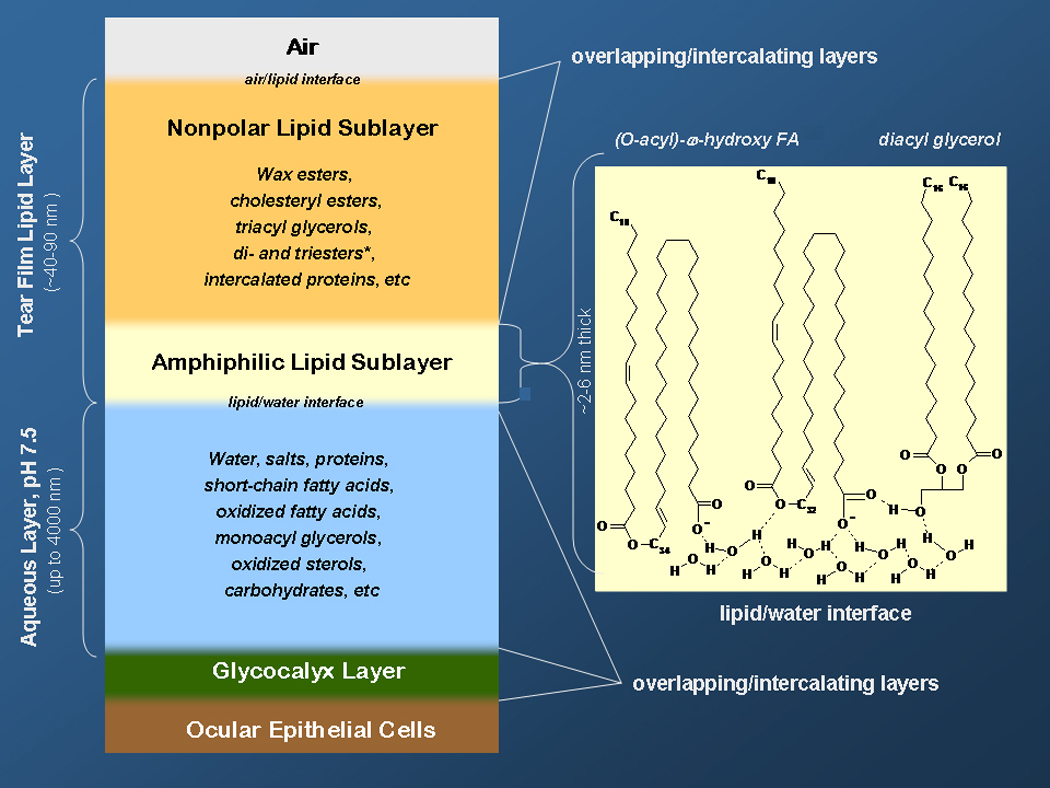
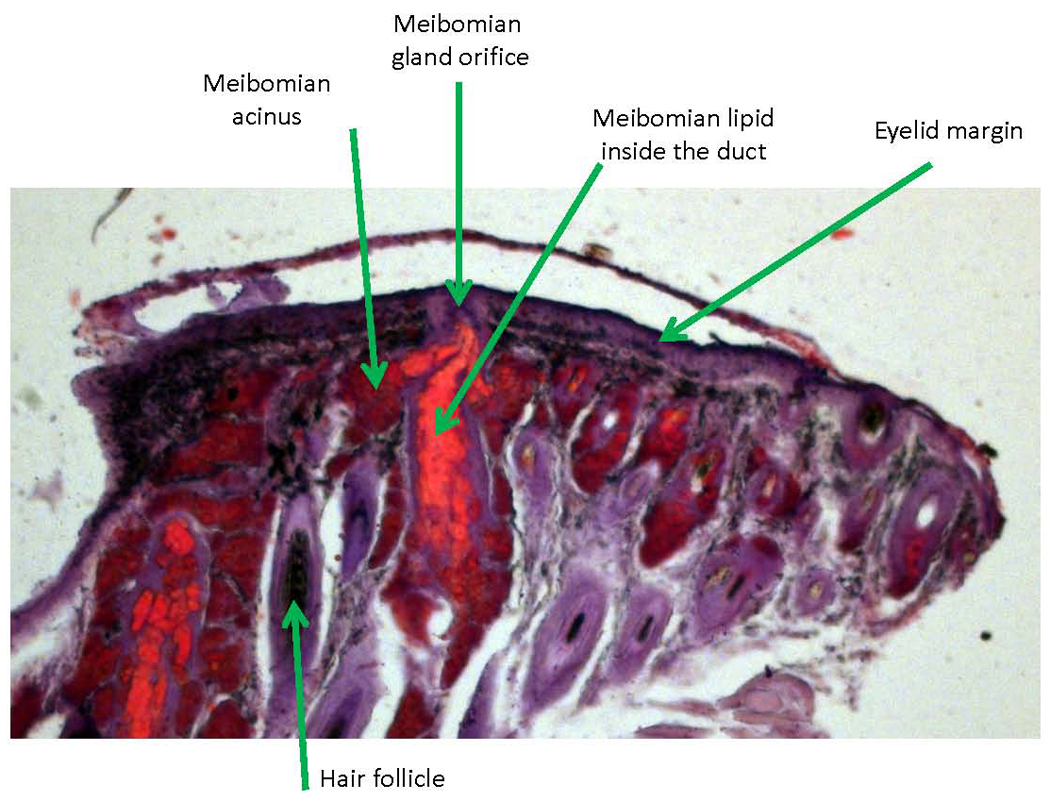
Human Meibomian gland secretions (MGS) are a complex mixture of diverse lipids that are produced by Meibomian glands that are located in the upper and the lower eyelids. During blinking, MGS are excreted onto the ocular surface, spread and mix with aqueous tears that are produced by lachrymal glands, and form an outermost part of an ocular structure called "the tear film" (TF). The main physiological role of TF is to protect delicate ocular structures (such as cornea and conjunctiva) from desiccating. Lipids that are produced by Meibomian glands are believed to "seal" the aqueous portion of TF by creating a hydrophobic barrier and, thus, retard evaporation of water from the ocular surface, which enhances the protective properties of TF. As lipids of MGS are interacting with underlying aqueous sublayer of TF, the chemical composition of MGS is critical for maintaining the overall stability of TF. There is a consensus that a small, but important part of Meibomian lipids, namely polar, or amphiphilic lipids, is of especial importance as it forms an intermediate layer between the aqueous layer of TF and its upper (and much thicker) lipid layer formed mostly of very nonpolar lipids, such as wax esters and cholesteryl esters. The purpose of this review is to summarize the current knowledge on the lipidomics of human MGS, including the discussions of the most effective modern analytical techniques, chemical composition of MGS, biophysical properties of Meibomian lipid films, and their relevance for the physiology of TF. Previously published results obtained in numerous laboratories, as well as novel data generated in the author's laboratory, are discussed. It is concluded that despite a substantial progress in the area of Meibomian glands lipidomics, there are large areas of uncertainty that need to be addressed in future experiments.
Copyright © 2011 Elsevier Ltd. All rights reserved.
Figures
Similar articles
-
Tear film lipids.Exp Eye Res. 2013 Dec;117:4-27. doi: 10.1016/j.exer.2013.05.010. Epub 2013 Jun 12. Exp Eye Res. 2013. PMID: 23769846 Free PMC article. Review.
-
Lipidomic analysis of meibomian gland secretions from the tree shrew: Identification of candidate tear lipids critical for reducing evaporation.Chem Phys Lipids. 2019 May;220:36-48. doi: 10.1016/j.chemphyslip.2019.01.003. Epub 2019 Jan 17. Chem Phys Lipids. 2019. PMID: 30660743 Free PMC article.
-
Insertion of tear proteins into a meibomian lipids film.Colloids Surf B Biointerfaces. 2005 Jul 25;44(1):49-55. doi: 10.1016/j.colsurfb.2005.05.011. Colloids Surf B Biointerfaces. 2005. PMID: 16006106
-
Analysis of Comparison of Human Meibomian Lipid Films and Mixtures with Cholesteryl Esters In Vitro Films using High Resolution Color Microscopy.Invest Ophthalmol Vis Sci. 2012 Jul 10;53(8):4710-9. doi: 10.1167/iovs.12-10022. Invest Ophthalmol Vis Sci. 2012. PMID: 22695957 Free PMC article.
-
Structure-function relationship of tear film lipid layer: A contemporary perspective.Exp Eye Res. 2017 Oct;163:17-28. doi: 10.1016/j.exer.2017.03.013. Exp Eye Res. 2017. PMID: 28950936 Review.
Cited by
-
A comparative study of the quality of non-stimulated and stimulated tears in normal eye male subjects using the tear ferning test.Clin Optom (Auckl). 2019 Jul 3;11:65-71. doi: 10.2147/OPTO.S214597. eCollection 2019. Clin Optom (Auckl). 2019. PMID: 31308779 Free PMC article.
-
Glycosylation pathways at the ocular surface.Biochem Soc Trans. 2018 Apr 17;46(2):343-350. doi: 10.1042/BST20170408. Epub 2018 Mar 9. Biochem Soc Trans. 2018. PMID: 29523772 Free PMC article. Review.
-
Efficacy of intra-meibomian gland injection of the anti-VEGF agent bevacizumab for the treatment of meibomian gland dysfunction with lid-margin vascularity.Drug Des Devel Ther. 2018 May 16;12:1269-1279. doi: 10.2147/DDDT.S146556. eCollection 2018. Drug Des Devel Ther. 2018. PMID: 29805249 Free PMC article.
-
Dry eye disease: A review of diagnostic approaches and treatments.Saudi J Ophthalmol. 2014 Jul;28(3):173-81. doi: 10.1016/j.sjopt.2014.06.002. Epub 2014 Jun 24. Saudi J Ophthalmol. 2014. PMID: 25278793 Free PMC article.
-
Another Brick in the Wall of Tear Film Insights Added Through the Total Synthesis and Biophysical Profiling of anteiso-Branched Wax and Cholesteryl Esters.J Nat Prod. 2024 Apr 26;87(4):954-965. doi: 10.1021/acs.jnatprod.3c01247. Epub 2024 Mar 28. J Nat Prod. 2024. PMID: 38547477 Free PMC article.
References
-
- Kaercher T, Bron AJ. Classification and diagnosis of dry eye. Dev Ophthalmol. 2008;41:36–53. - PubMed
-
- Tiffany JM. The normal tear film. Dev Ophthalmol. 2008;41:1–20. - PubMed
-
- Flanagan JL, Willcox MD. Role of lactoferrin in the tear film. Biochimie. 2009;91:35–43. - PubMed
-
- Nichols KK, Mitchell GL, Zadnik K. The repeatability of clinical measurements of dry eye. Cornea. 2004;23:272–285. - PubMed
-
- Sullivan BD, Whitmer D, Nichols KK, Tomlinson A, Foulks GN, Geerling G, et al. An objective approach to dry eye disease severity. Invest Ophthalmol Vis Sci. 2010;51:6125–6130. - PubMed
Publication types
MeSH terms
Substances
Grants and funding
LinkOut - more resources
Full Text Sources
Other Literature Sources
Medical
Research Materials
Miscellaneous
