. 2011 Jun 15;56(4):1982-92.
doi: 10.1016/j.neuroimage.2011.03.045. Epub 2011 Mar 31.

Simple paradigm for extra-cerebral tissue removal: algorithm and analysis

Affiliations

Simple paradigm for extra-cerebral tissue removal: algorithm and analysis

Aaron Carass et al. Neuroimage. .

Abstract

Extraction of the brain-i.e. cerebrum, cerebellum, and brain stem-from T1-weighted structural magnetic resonance images is an important initial step in neuroimage analysis. Although automatic algorithms are available, their inconsistent handling of the cortical mantle often requires manual interaction, thereby reducing their effectiveness. This paper presents a fully automated brain extraction algorithm that incorporates elastic registration, tissue segmentation, and morphological techniques which are combined by a watershed principle, while paying special attention to the preservation of the boundary between the gray matter and the cerebrospinal fluid. The approach was evaluated by comparison to a manual rater, and compared to several other leading algorithms on a publically available data set of brain images using the Dice coefficient and containment index as performance metrics. The qualitative and quantitative impact of this initial step on subsequent cortical surface generation is also presented. Our experiments demonstrate that our approach is quantitatively better than six other leading algorithms (with statistical significance on modern T1-weighted MR data). We also validated the robustness of the algorithm on a very large data set of over one thousand subjects, and showed that it can replace an experienced manual rater as preprocessing for a cortical surface extraction algorithm with statistically insignificant differences in cortical surface position.


Figures

Figure 1
Figure 1
(a) A cross section through an MR brain volume. The brain extracted by (b) a manual rater, (c) Brain Extraction Tool (BET version 2.1), and (d) our approach. (e) is the zoomed region represented by the red box for the MR brain volume, while (f) is the corresponding region for the manual rater. (g) and (h) are the zoomed regions for BET and our approach, respectively. The brain mask extracted by a manual rater is shown in (i) as a red overlay on the original, (j) is the Brain Extraction Tool (BET version 2.1) result shown as a green overlay, while (k) is a blue overlay of the mask generated by our algorithm, SPECTRE.
Figure 2
Figure 2
A topographical representation of a slice of a T1 weighted MR image. The heights are the intensities of the image, shown inset, the colors also correspond to the intensities and are used for display purposes only.
Figure 3
Figure 3
Flow Chart describing the basic components of SPECTRE. A is the input image. B denotes the flow from the input image registered against 4 atlas images to the creation of the probability mask, formula imageABA. C shows the hard tissue segmentation. D is the morphological operations phase of the algorithm. Image 4, in D, must pass a sanity check before it is approved as the mask.
Figure 4
Figure 4
(a) Original image, (b) Probability mask, (c) Tissue classification, (d) initial mask formula image1, (e) mask after erosion and retaining largest connected component, (f) mask after hill descent but prior to the topologically constrained morphological closing.
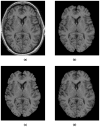
Figure 5
Figure 5
(a) Original image, (b) ( formula imageH1) human rater, (c) ( formula imageH2) an alternative human rater and (d) ( formula imageS) output from SPECTRE.
Figure 6
Figure 6
The worst result from the study of 1046 data sets, with the subject having a Dice coefficient of 0.88481. We show (a) the original image, (b) the human rater ( formula imageG), and (c) the result from SPECTRE ( formula imageS). The corresponding Containment Index score for this subject is 0.99779, see the text for an explanation of these numbers.
Figure 7
Figure 7
The annotated line graph shows the Dice scores for each of the seven algorithms (SPECTRE, Brain Surface Extractor (BSE), Brain Extraction Tool (BET), Watershed Algorithm (WAT), Hybrid Watershed Algorithm (HWA), Graph Cuts algorithm (GCUT), and an approach based on the intersection of the masks of GCUT and HWA (GCUT-HWA)) on each of IBSR Set 1 (18 1.5mm scans). The y-axis is the corresponding Dice score (closer to 1.0 is better), while the x-axis is an index over the 18 IBSR Set 1 subjects. SPECTRE appears to perform better than the other approaches, it ranks highest in 11 of the 18 subjects.
Figure 8
Figure 8
The annotated line graph shows the Dice scores for each of the seven algorithms (SPECTRE, Brain Surface Extractor (BSE), Brain Extraction Tool (BET), Watershed Algorithm (WAT), Hybrid Watershed Algorithm (HWA), Graph Cuts algorithm (GCUT), and an approach based on the intersection of the masks of GCUT and HWA (GCUT-HWA)) on each of IBSR Set 2 (20 3.1mm scans). The y-axis is the corresponding Dice score (closer to 1.0 is better), while the x-axis is an index over the 20 IBSR Set 2 subjects. SPECTRE appears to perform better than the other approaches, it ranks highest in eight of the 20 subjects.
Figure 9
Figure 9
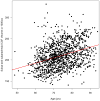
Shown is the linear fit for the Dice Coefficient against Age for the one thousand and forty six subjects used in Experiment 2. The Dice Coefficient is based on a comparison between our approach and an expert human rater. The p-value for the significance of Age in a linear model with the Dice Coefficient is less than 2 × 10⁻¹⁶.
Figure 10
Figure 10
Shown is the linear fit for the Containment Coefficient against Age for the one thousand and forty six subjects used in Experiment 2. The Containment Index is based on a comparison between our approach and an expert human rater. The linear model is increasing but is not statistically significant.
Figure 11
Figure 11
Shown is the linear fit for the sulcal and subarachnoid CSF volume against Age for the one thousand and forty six subjects used in Experiment 2. The p-value for the significance of Age in a linear model with the CSF volumes is less than 2 × 10⁻¹⁶.
Figure 12
Figure 12
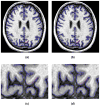
(a) Shows the CRUISE outer surface derived from the skull stripping of a human rater, (b) is the CRUISE outer surface based on the output of our algorithm. Both (a) and (b) show the landmarks used on this slice, as red crosses in the posterior portion on the brain, these are some of the landmarks used in Experiment 3. In this case they are landmarks for the banks of the parieto-occipital sulcus on the outer surface. (c) & (d) show a zoomed in image centered on the landmarks (red crosses) with (c) being the outer surface derived from the human rater and (d) the corresponding result for our algorithm.

References

    1. Acosta-Cabronero J, Williams GB, Pereira JMS, Pengas G, Nestor PJ. The imapct of skull-stripping and radio-frequency bias correction on grey-matter segmentation for voxel based morphometry. NeuroImage. 2008;39 (4):1654–1665. - PubMed
    1. Ashburner J, Friston KJ. Voxel-based morphometry: the methods. NeuroImage. 2000;11 (6):805–821. - PubMed
    1. Bazin PL, Cuzzocreo JL, Yassa MA, Gandler W, McAuliffe MJ, Bassett SS, Pham DL. Volumetric neuroimage analysis extensions for the MIPAV software package. Journal of Neuroscience Methods. 2007;165:111–121. - PMC - PubMed
    1. Bazin PL, Pham DL. Topology-Preserving Tissue Classification of Magnetic Resonance Brain Images. IEEE Trans Med Imag. 2007;26 (4):487–496. - PubMed
    1. Boesen K, Rehm K, Schaper K, Stoltzner S, Woods R, Luders E, Rottenberg D. Quantitative comparison of four brain extraction algorithms. NeuroImage. 2004;22 (3):1255–1261. - PubMed

Publication types

LinkOut - more resources