. 2011 Apr 1;145(1):104-16.
doi: 10.1016/j.cell.2011.02.034.

Bcl-x(L) retrotranslocates Bax from the mitochondria into the cytosol

Affiliations

Bcl-x(L) retrotranslocates Bax from the mitochondria into the cytosol

Frank Edlich et al. Cell. .

Abstract

The Bcl-2 family member Bax translocates from the cytosol to mitochondria, where it oligomerizes and permeabilizes the mitochondrial outer membrane to promote apoptosis. Bax activity is counteracted by prosurvival Bcl-2 proteins, but how they inhibit Bax remains controversial because they neither colocalize nor form stable complexes with Bax. We constrained Bax in its native cytosolic conformation within cells using intramolecular disulfide tethers. Bax tethers disrupt interaction with Bcl-x(L) in detergents and cell-free MOMP activity but unexpectedly induce Bax accumulation on mitochondria. Fluorescence loss in photobleaching (FLIP) reveals constant retrotranslocation of WT Bax, but not tethered Bax, from the mitochondria into the cytoplasm of healthy cells. Bax retrotranslocation depends on prosurvival Bcl-2 family proteins, and inhibition of retrotranslocation correlates with Bax accumulation on the mitochondria. We propose that Bcl-x(L) inhibits and maintains Bax in the cytosol by constant retrotranslocation of mitochondrial Bax.


Figures

Figure 1
Figure 1. Disulfide bonds constrain Bax in its inactive fold
(A) Depiction of the three-dimensional structure of Bax (PDB, 1F16) containing cysteine substitutions for F30, E44, L63 and P130 (red sticks) to form disulfide bonds constraining α helices 1 (green) and 2 (1–2) and the loop (orange) between α helices 1 and 2 and α helix 6 (L-6) using Pymol software (DeLano Scientific LLC). Helix 2 is depicted in blue; helix 6 in yellow. (B) The disulfide bond formation of cysteine GFP-Bax variants in HCT116 Bax/Bak DKO cells was analyzed by SDS-PAGE and Western blot of cell extracts in the presence and absence of β-mercaptoethanol (BME) using rabbit α-GFP antibody. (C) Selected spectra of NOESY experiment for Bax 1–2/L-6 and wt Bax. Each strip for the indicated tryptophan side chain labeled above was extracted from the 15N-edited 3D NOESY spectra. Left panels were obtained from wt Bax, while the right panels were from Bax 1–2/L-6. Crosspeaks for NOE interactions for wt Bax were identified from 15N-edited 3D NOESY as well as 13C/15N-edited 4D NOESY. Identical strips are displayed for Bax 1–2/L-6, confirming that the fold of the Bax variant is the same as that of wt Bax.
Figure 2
Figure 2. Constraining Bax prevents pro-apoptotic activity and inhibition by Bcl-xL
(A) Staurosporine (STS, 1 µM)-induced apoptosis activity of Bax ΔSH and Bax 1–2/L-6 based on caspase 3/7 activity measured in HCT116 Bax/Bak DKO cells relative to the activity obtained with wt Bax and normalized to mock transfected cells. Results were obtained without (grey) or with (black) over-expressed Bcl-xL. Data represent averages ± SD. n ≥ 5×5 wells. (B) Cyt c release from the mitochondria analyzed microscopically in HCT116 Bax/Bak DKO cells expressing different GFP-Bax variants after apoptosis induction by 1 µM STS. Results were obtained without (grey) or with (black) over-expressed Bcl-xL. Data represent averages ± SD from triplicates. n ≥ 125 cells. (C) LDH activity measured after transfecting HCT116 Bax/Bak DKO cells with different GFP-Bax variants for 24 h and inducing apoptosis with 1 µM STS for 16 h relative to the activity obtained with cells transfected with GFP-Bax wt and normalized to mock transfected cells. Results were obtained with (black) or without (gray) over-expressed Bcl-xL. Data represent averages ± SD. n ≥ 4×5 wells. (D) Cyt c release from purified mitochondria by wt Bax and Bax 1–2/L-6 in absence and presence of tBid. Cyt c is monitored in the supernatant and pellet by Western blot. VDAC serves as a loading control.
Figure 3
Figure 3. Bax 1–2/L-6 localizes to the mitochondria
(A) Confocal imaging of HCT116 Bax/Bak DKO transfected with GFP-Bax ΔSH or GFP-Bax 1–2/L-6 with or without treatment with 1 µM actinomycinD (ActD) for 2 h. Q-VD was used to prevent caspase activation. GFP-fluorescence is depicted in the second panels and in green in the merge and detail, whereas α-Tom20 staining is shown in the left panels and in red in the merged and detail images. In the merged and detail images co-localization is shown in yellow. The white line in the low right corner of every image is the scale of 10 µm. White broken lines in the merge images show the section analysed in the line scans (B). The merged section depicted in the detail panel is indicated by a white box. (B) Line scans show the fluorescence intensities of GFP-Bax signals (green) and mitochondria stained by α-Tom20 staining (red) along the selected line (A) in cells transfected with GFP-Bax ΔSH or Bax 1–2/5–6 either with or without ActD treatment. (C) Quantification of confocal images of HCT116 Bax/Bak DKO cells transfected with either GFP-Bax ΔSH or 1–2/L-6 showing either pre-dominantly cytosolic Bax (black) or mitochondrial Bax (grey) cell populations in percent of the total cell population after 2 h treatment with 1 µM ActD with or without Bcl-xL co-expression. Data represent averages of triplicates ± SD. n ≥ 150 cells. (D) GFP-Bax wt and GFP-Bax 1–2/L-6 localization in HCT116 Bax/Bak DKO cells analyzed by SDS-PAGE and Western blot after fractionation into cytosol (C) and heavy membrane fraction (HM) and subjecting membrane-bound proteins to carbonate extraction and analyzing pellet (P) and supernatant (S) with rabbit α-GFP, rabbit α-GAPDH, mouse α-cyt c and rabbit α-Tom20 antibodies.
Figure 4
Figure 4. Wild-type Bax retrotranslocates from the mitochondria into the cytoplasm
(A) GFP-Bax fluorescence is monitored in a FLIP experiment with 15 bleachings at 488 nm in the region marked □. Changes in Bax fluorescence on the mitochondria are detected in two areas (formula image;formula image) and an additional area monitors changes in the cytosolic fluorescence (formula image
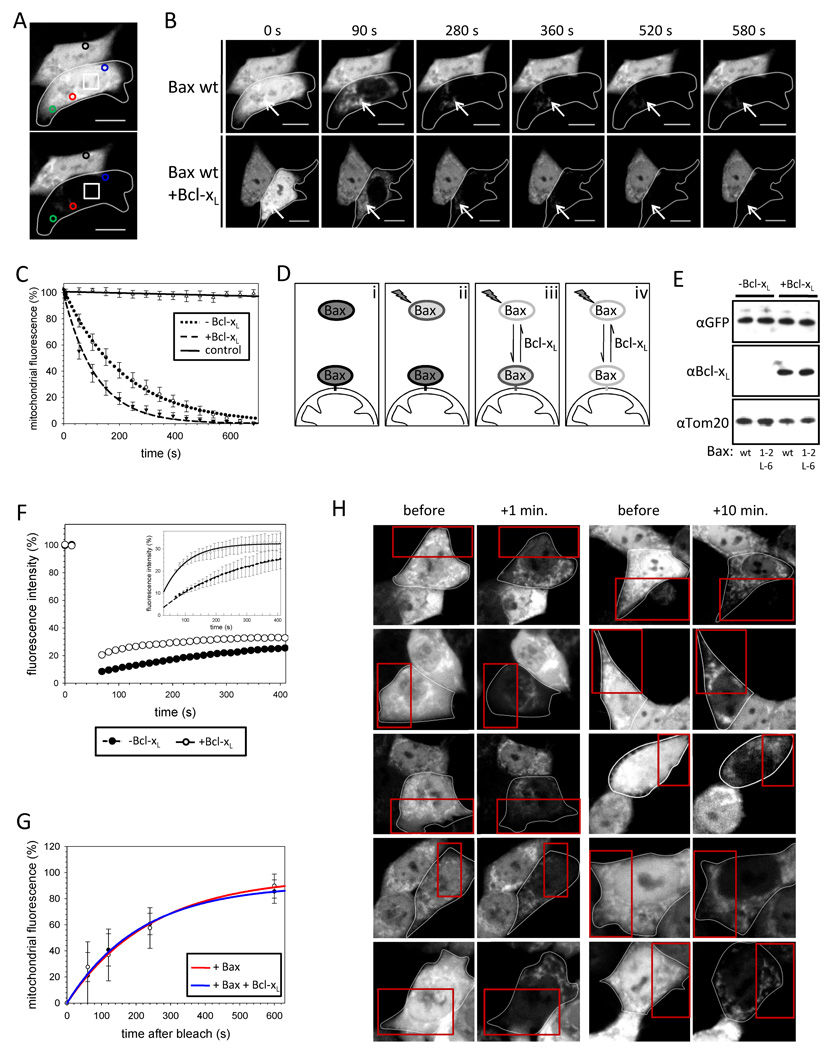
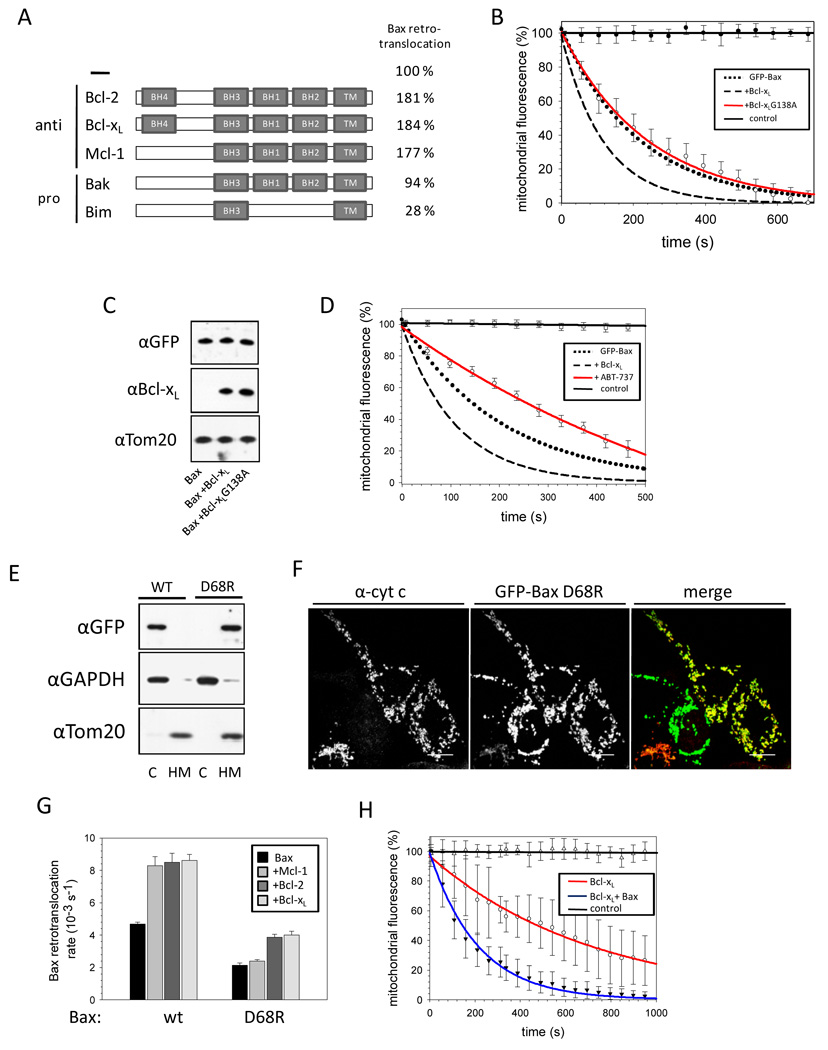
), whereas a ROI measurement in the neighboring cell serves as a control for cell specific bleaching (○). (B) FLIP of GFP-Bax in the absence (top) and presence (bottom) of over-expressed Bcl-xL diminishes GFP-Bax fluorescence in the cytoplasm of both targeted cells (circled) completely after 90 s and GFP fluorescence is detected only on the mitochondria (arrows). Although the mitochondrial GFP-Bax signal in the presence of over-expressed Bcl-xL is lower at 90 s. Time points in seconds are displayed above the pictures. (C) Bcl-xL increases the rate of Bax retrotranslocation. FLIP of mitochondrial GFP-Bax in the absence (○) and presence (▼) of over-expressed Bcl-xL. Fluorescence of the neighboring cell is shown as control (∇). Data represent averages ± SEM from 20 ROI measurements per condition. (D) Prior to FLIP GFP-Bax localizes to mitochondria and cytosol (i). FLIP bleaches cytosolic Bax (ii), but in addition the mitochondrial fluorescence is diminished, because bleached Bax molecules translocate to the mitochondria while fluorescent GFP-Bax retrotranslocates into the cytoplasm dependent on Bcl-xL (iii). After extended time of 15 FLIP iterations all GFP-Bax molecules are bleached (iv). (E) Similar levels of GFP-Bax wt and GFP-Bax 1–2/L-6 expression in HCT116 Bax/Bak DKO cells in presence and absence of Bcl-xL over-expression analyzed by SDS-PAGE and Western blot using rabbit α-GFP, mouse α-Bcl-xL and rabbit α-Tom20 antibodies. (F) GFP-Bax fluorescence is recovering in the cytoplasm after a single bleach at 488 nm (inset shows magnification) and Bcl-xL is increasing the rate of this fluorescence intensity regain consistent with the FLIP experiments. Data represent averages ± SEM from 22 (−Bcl-xL) and 16 (+Bcl-xL) ROI measurements. (G) Translocation of Bax to the mitochondria of healthy cells analyzed by cell bleaching (Figure S4E). Recovery of mitochondrial GFP-Bax wt fluorescence 1, 2, 4 and 10 min. after bleach was compared in the absence (red, ○) or presence (blue, ●) of Bcl-xL to unbleached mitochondria in 12 different cells per data point. (H) HCT116 Bax/Bak DKO cells expressing GFP-Bax wt imaged before the analysis by bleaching (first and third panels from the left). Then the cells (circled) were bleached in the 32 area in the red squares. After 1 or 10 min. the fluorescence in the cytoplasm was bleached and the cells were imaged (second and forth panels, respectively) for analysis (in (G)).
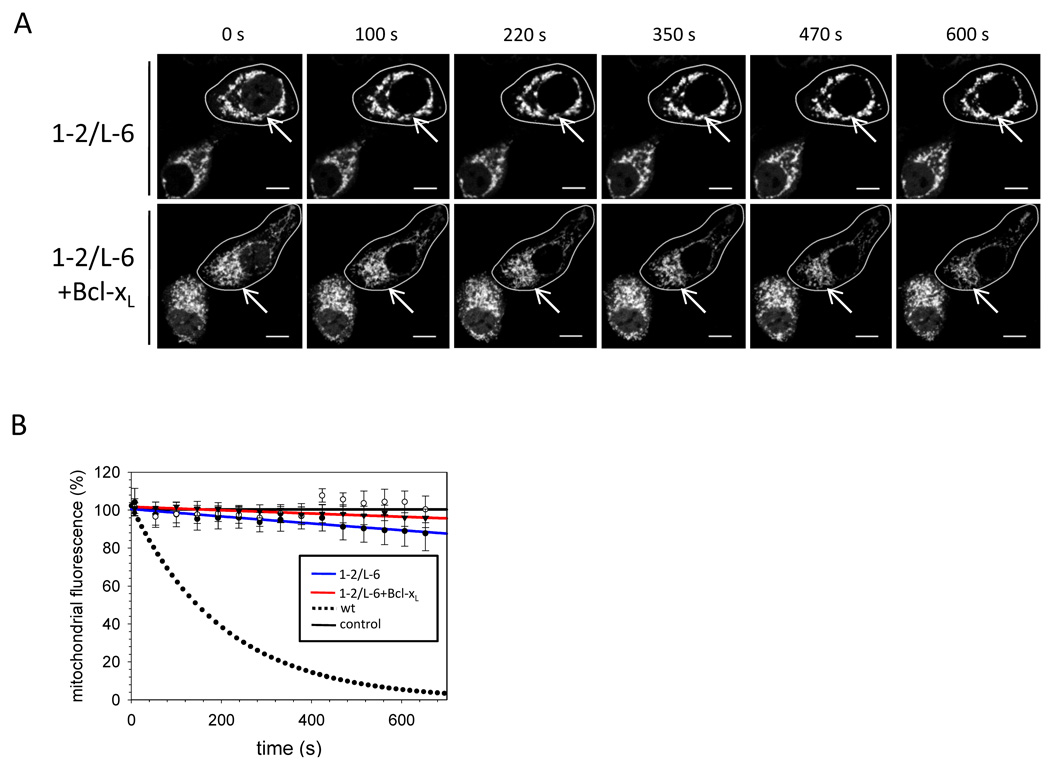
Figure 5
Figure 5. Bax 1–2/L-6 is deficient in retrotranslocation
(A) Time course recorded for GFP-Bax 1–2/L-6 in the absence (top) and presence (bottom) of over-expressed Bcl-xL in FLIP experiments. FLIP diminishes GFP-Bax 1–2/L-6 in the cytoplasm of a targeted cell (circled) quickly in parallel to wt Bax, but mitochondrial signals (arrows) remain stable. Time points in seconds during FLIP iterations are displayed above the pictures. (B) FLIP of mitochondrial GFP-Bax 1–2/L-6 as shown in (A) in the absence (blue, ●) and presence (red, ▼) of over-expressed Bcl-xL. The neighboring cell fluorescence (○) and cells transfected with GFP-Bax wt (●●●) serve as controls. Data represent averages ± SEM from 20 (Bax 1–2/L-6 − Bcl-xL) and 18 (Bax 1–2/L-6 + Bcl-xL) ROI measurements.
Figure 6
Figure 6. Bax retrotranslocation depends on interactions between BH3 and pro-survival Bcl-2 proteins
(A) Influence of Bax interaction partners on retrotranslocation. Pro-survival and proapoptotic Bax interaction partners are displayed as schematic depiction of their Bcl-2 homology domain (BH) organization, with the C-terminal trans-membrane domains (TM) on the right. Bax retrotranslocation rates in presence and absence of over-expressed Bcl-2, Bcl-xL, Mcl-1 or Bim measured in HCT116 Bax/Bak DKO or in HCT116 Bax KO for measurements in presence of endogenous Bak are depicted on the right in %. (B) Interactions between Bcl-xL and Bax are implicated in retrotranslocation. FLIP of GFP-Bax in the absence (●●●) or presence of Bcl-xL wt (---) or Bcl-xL G138A (red, ○). The neighboring cell fluorescence serves as control (──). Data display averages ± SEM from 12 ROI measurements per condition. (C) Similar expression levels of Bcl-xL variants in HCT116 Bax/Bak DKO cells analyzed by SDS-PAGE and Western blot using mouse α-Bcl-xL, rabbit α-GFP to probe for GFP-Bax over-expression and rabbit α-Tom20 antibodies. (D) FLIP experiment with GFP-Bax in absence (●●●) and presence (---) of over-expressed Bcl-xL or Bcl-xL inhibitor ABT-737 (red, ○). The fluorescence of the neighboring cell serves as control (──). Data represent averages ± SEM from 24 (+ABT-737) and 10 (+DMSO) ROI measurements. (E) GFP-Bax wt and GFP-Bax D68R localization in HCT116 Bax/Bak DKO cells analyzed by SDS-PAGE and Western blot after fractionation into cytosol (C) and heavy membrane fraction (HM) with rabbit α-GFP, rabbit α-GAPDH and rabbit α-Tom20 antibodies. (F) Confocal images of HCT116 Bax/Bak DKO cells transfected with GFP-Bax D68R (center, green in the merge) and stained for cyt c (left, red in the merge). Co-localization between Bax D68R and cyt c is shown as yellow in the merge (right), when cyt c is not released from the mitochondria without apoptotic stimuli. The white line in the low right corner of every image is the scale of 10 µm. (G) Retrotranslocation rates measured for Bax wt and Bax D68R in absence (black) and presence of Mcl-1 (gray), Bcl-2 (dark grey) or Bcl-xL (light grey). Data represent averages ± SD. (H) FLIP analysis of GFP-Bcl-xL in absence (red, ○) and presence (blue, ▼) of over-expressed Bax. The fluorescence of the neighboring cell serves as control (──). Data represent averages ± SEM from 15 (−Bax) and 15 (+Bax) ROI measurements.
Figure 7
Figure 7. Mitochondrial Bax 1–2/L-6 is 6A7-positive
(A) Confocal imaging of HCT116 Bax/Bak DKO cells transfected with GFP-Bax 1–2/L-6 in the presence and absence of ActD (1 µm) treatment for 2 h. Q-VD was used to prevent caspase activation. α-6A7 staining is shown in the left panels or in red in the merged and detailed pictures on the right. GFP-Bax 1–2/L-6 is depicted in the second panels or in green in the merge and detail panels, where co-localization is shown in yellow. The white lines show the scale of 10 µm. The merged section depicted in the detail panel is indicated by a white box. (B) α-6A7 staining is quantified in HCT116 Bax/Bak DKO cells expressing GFP-Bax ΔSH or GFP-Bax 1–2/L-6 with or without Bcl-xL over-expression. Data represent averages from triplicates ± SD. n ≥ 150 cells. p values according the unpaired student t-test for the comparison with Bax wt in the absence of over-expressed Bcl-xL are depicted. (C) Comparison of the Pearson’s coefficient for the co-localization between α-6A7 staining and GFP fluorescence in HCT116 Bax/Bak DKO cells transfected with either GFP-Bax ΔSH or 1–2/L-6. The confidence range is depicted as box with the mean (□ □) of the data set. Dots represent the most extreme data points for GFP-Bax 1–2/L-6. n ≥ 10 cells. The p value for both data sets according to the unpaired student t-test is depicted. (D) Time-dependent changes in α-6A7 staining monitored by confocal imaging in HCT116 Bax/Bak DKO cells expressing GFP-Bax 1–2/L-6 in % of total expressing cell population. Individual measurements are displayed as open circles with the mean shown as black circle ± SD. (E) Bax (red) and Bcl-xL (blue) constantly translocate to the mitochondria and co-retrotranslocation back into the cytosol, stabilizing cytosolic Bax in healthy cells. Retrotranslocation requires a conformational change in Bax. (F) In the absence of free Bcl-xL mitochondrial Bax may undergo further conformational changes that can lead to Bax activity or integration into the membrane.

Comment in

References

    1. Arnoult D, Bartle LM, Skaletskaya A, Poncet D, Zamzami N, Park PU, Sharpe J, Youle RJ, Goldmacher VS. Cytomegalovirus cell death suppressor vMIA blocks Bax- but not Bak-mediated apoptosis by binding and sequestering Bax at mitochondria. Proc. Natl. Acad. Sci. USA. 2004;101:7988–7993. - PMC - PubMed
    1. Bessette PH, Ãslund F, Beckwith J, Georgiou G. Efficient folding of proteins with multiple disulfide bonds in the Escherichia coli cytoplasm. Proc. Natl. Acad. Sci. USA. 1999;96:13703–13708. - PMC - PubMed
    1. Chen L, Willis SN, Wei A, Smith BJ, Fletcher JI, Hinds MG, Colman PM, Day CL, Adams JM, Huang DC. Differential targeting of prosurvival Bcl-2 proteins by their BH3-only ligands allows complementary apoptotic function. Mol. Cell. 2005;17:393–403. - PubMed
    1. Chipuk JE, Green DR. How do BCL-2 proteins induce mitochondrial outer membrane permeabilization? Trends Cell Biol. 2008;18:157–164. - PMC - PubMed
    1. Cory S, Adams JM. The Bcl2 family: regulators of the cellular life-or-death switch. Nat. Rev. Cancer. 2002;2:647–656. - PubMed

Publication types