. 2011 Apr 1;145(1):133-44.
doi: 10.1016/j.cell.2011.02.008.

Presynaptic facilitation by neuropeptide signaling mediates odor-driven food search

Affiliations

Presynaptic facilitation by neuropeptide signaling mediates odor-driven food search

Cory M Root et al. Cell. .

Abstract

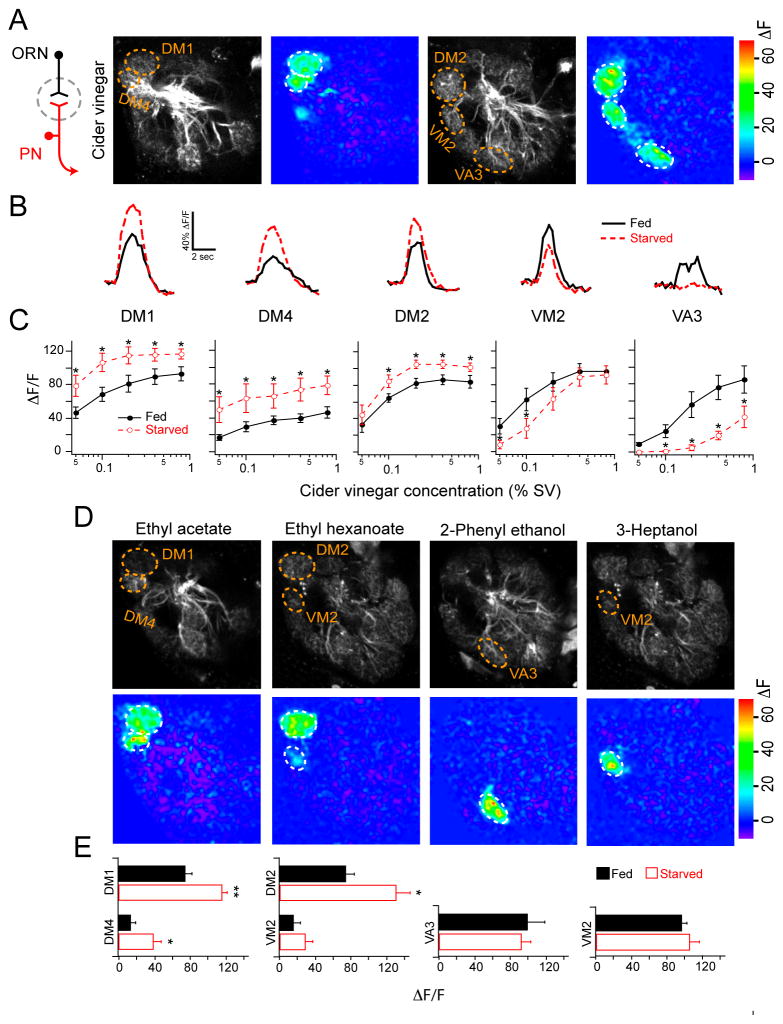
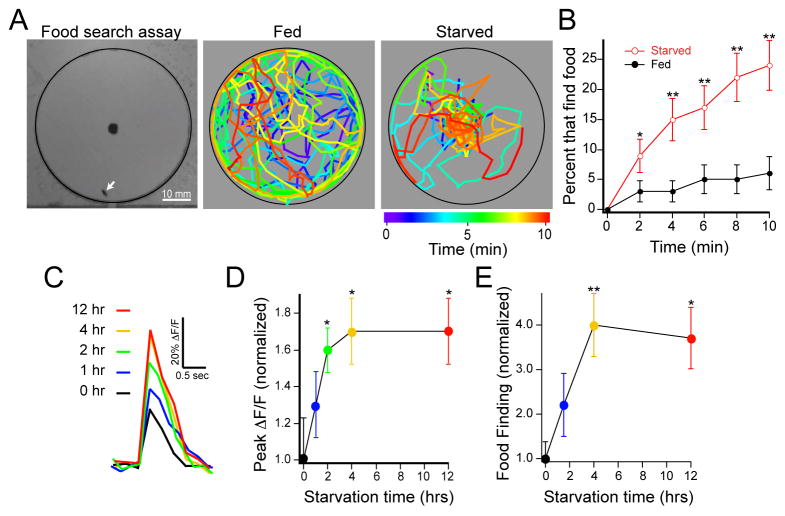
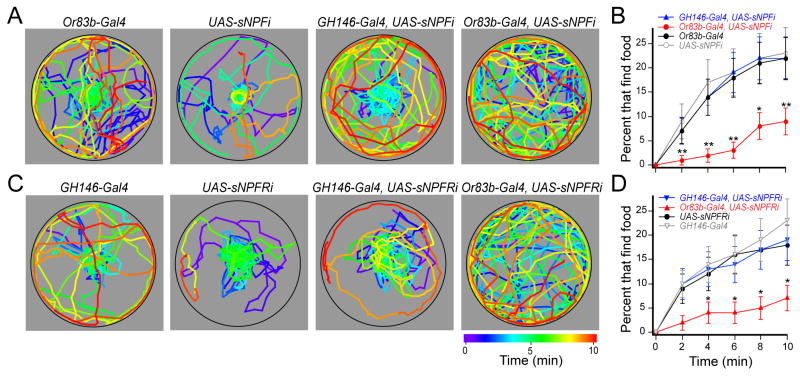
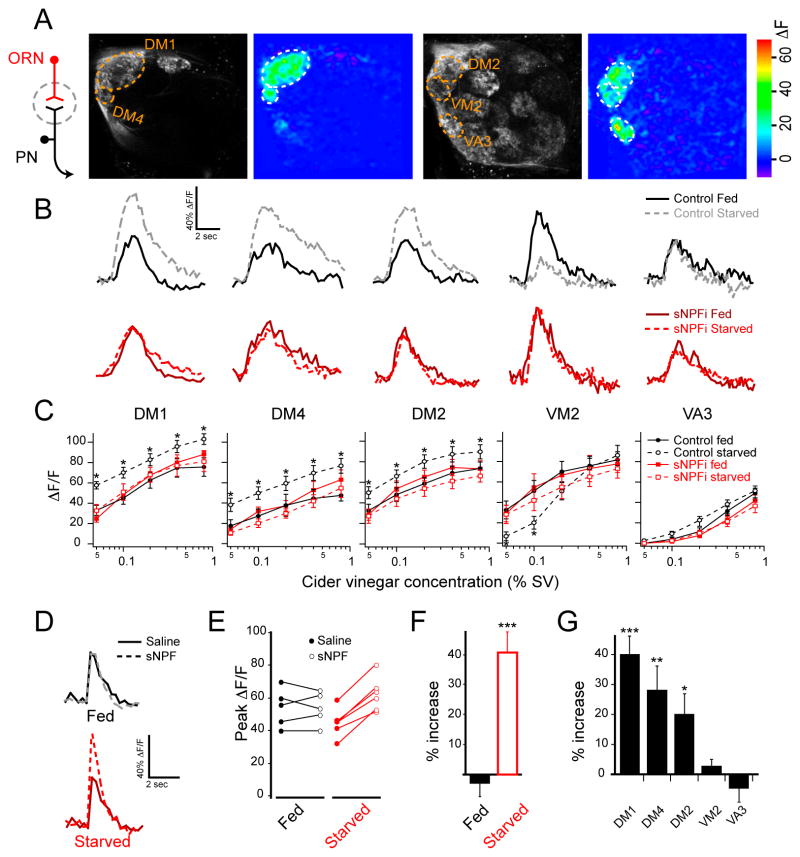
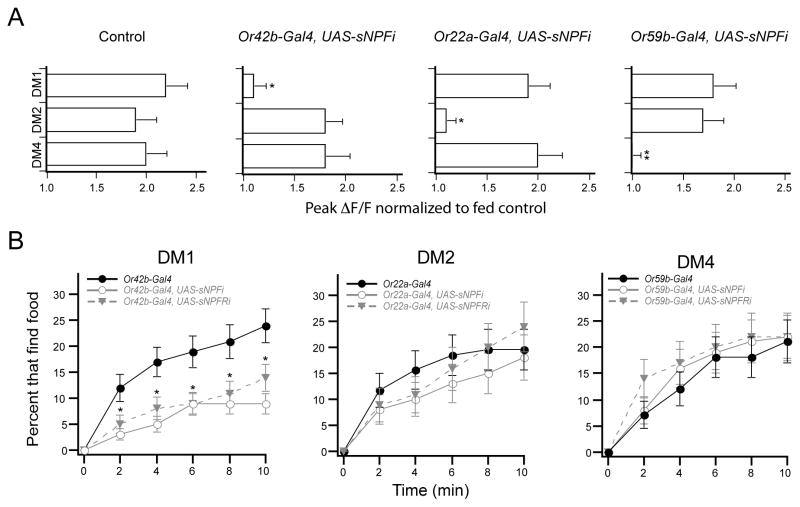
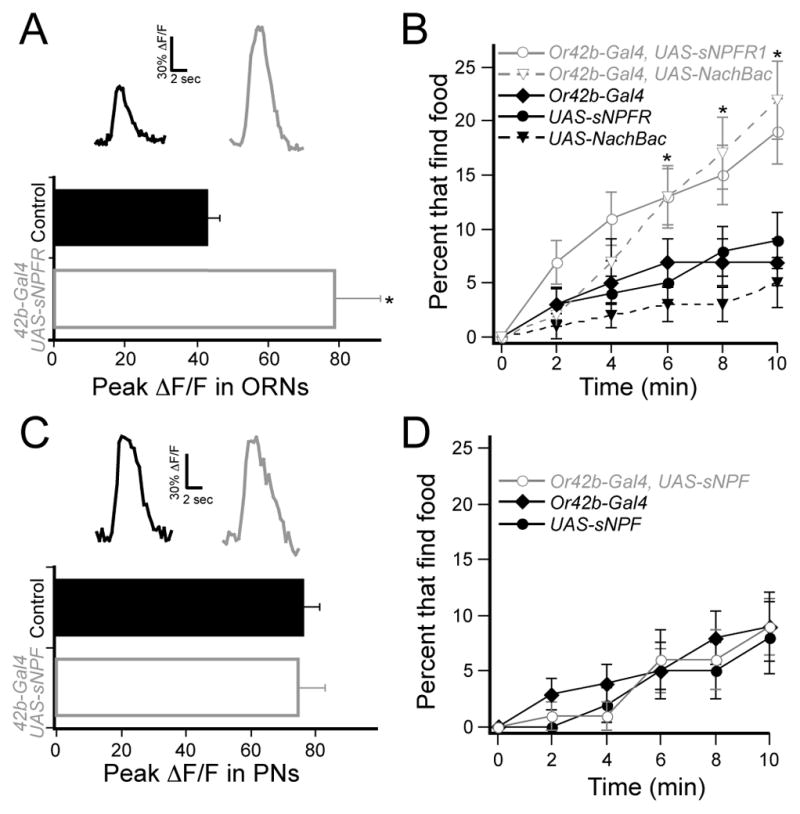
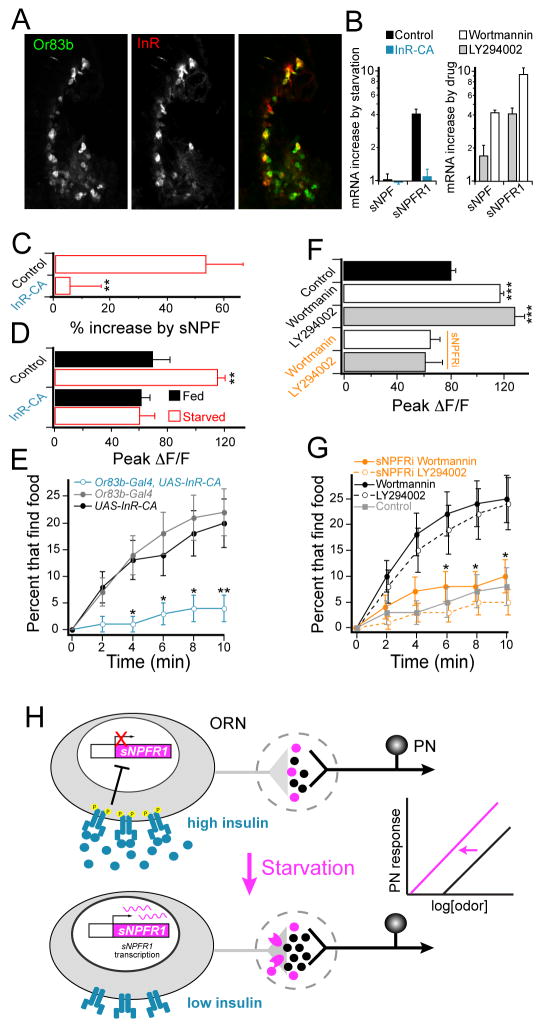
Internal physiological states influence behavioral decisions. We have investigated the underlying cellular and molecular mechanisms at the first olfactory synapse for starvation modulation of food-search behavior in Drosophila. We found that a local signal by short neuropeptide F (sNPF) and a global metabolic cue by insulin are integrated at specific odorant receptor neurons (ORNs) to modulate olfactory sensitivity. Results from two-photon calcium imaging show that starvation increases presynaptic activity via intraglomerular sNPF signaling. Expression of sNPF and its receptor (sNPFR1) in Or42b neurons is necessary for starvation-induced food-search behavior. Presynaptic facilitation in Or42b neurons is sufficient to mimic starvation-like behavior in fed flies. Furthermore, starvation elevates the transcription level of sNPFR1 but not that of sNPF, and insulin signaling suppresses sNPFR1 expression. Thus, starvation increases expression of sNPFR1 to change the odor map, resulting in more robust food-search behavior.


Conflict of interest statement

Competing Interest Statement: The authors declare they have no competing interest.

Figures

Figure 1
Figure 1. Olfactory representation in projection neurons is altered by starvation
A, Two-photon imaging of PN calcium activity in response to cider vinegar stimulation on two optical planes of the antennal lobe in fed flies. Gray-scale images show antennal lobe structure while pseudocolored images reveal odor-evoked activity at 0.4% SV (saturated vapor pressure). B, Representative traces of fluorescence change over time for the five glomeruli excited by cider vinegar at 0.1% SV. C, Peak ΔF/F across a range of cider vinegar concentrations for each glomerulus. D, PN activity of fed flies in response to pure odorants. E, Peak ΔF/F for each glomerulus. D,E, Odors were applied at the following concentrations (%SV): 1% ethyl acetate 1:10,000 in mineral oil, 0.1% ethyl hexanoate 1:10,000 in mineral oil, 0.5% 2-phenyl ethanol, and 0.1% 3-heptanol. C,E, n=5–10 for each condition; error bars show SEM. *P<0.05, **P<0.01; t-test. The flies have GH146-Gal4 and UAS-GCaMP. All starvations were 17–24 hrs.
Figure 2
Figure 2. Optimum food search behavior and peak olfactory sensitivity are reached within four hours of starvation
A, A food search assay was used to measure the latency of odor-guided food finding. Grayscale image (left) shows an arena with a food odor, 1% cider vinegar, in the center and a single fly (white arrow). The coordinates of single flies are plotted as a function of time in pseudocolor for a representative fed fly and one starved overnight. B, The latency of food search as the cumulative percentage of flies that find the odor source over time. C,D, Two-photon imaging of PN calcium activity in the DM1 glomerulus in response to electrical stimulation of the olfactory nerve. C, Representative traces of fluorescence change over time from the DM1 glomerulus in flies with varied starvation durations. D, Peak ΔF/F normalized to the average response without starvation. Stimulation was 1 ms in duration, 10 V in amplitude and 4 pulses at 100 Hz. n=5–8 for each starvation condition. Error bars show SEM. *P≤0.05, t-test E, Data from behavioral experiments with varied starvation durations shown as the food finding percentage normalized to that of the fed state. B,E n=53–102 flies for each condition. Error bars show SEM. *P≤0.05, **P≤0.01, z-test for proportions.
Figure 3
Figure 3. Starvation-dependent food search requires sNPF signaling in ORNs
The latency of odor-guided food finding was measured in starved flies with 1% cider vinegar. A, The coordinates of single flies for representative control flies (left two plots) and those expressing sNPF-RNAi (sNPFi) in PNs (third from left) or ORNs (right). B, The latency of food finding. C, The coordinates of two representative control flies (left two plots) and those expressing sNPFR1-RNAi (sNPFRi) in PNs (third from left) or ORNs (right). D, The latency of food finding. n=64–103 flies for each condition. Error bars show SEM. *P<0.05, **P<0.01; z-test for proportions comparing the top three curves to the bottom curve in B,D.
Figure 4
Figure 4. The sNPF receptor is upregulated upon starvation and mediates presynaptic facilitation in sensory neurons
A, Two-photon imaging of ORN axon terminal calcium activity in response to cider vinegar stimulation at 0.4% SV in fed flies. B, Representative traces of fluorescence change over time for the five glomeruli excited by 0.1% cider vinegar in control flies (top) and those expressing sNPF-RNAi in ORNs (sNPFi) (bottom). C, Peak ΔF/F across a range of cider vinegar concentrations for each glomerulus. n=10–12 each condition; error bars show SEM. *P<0.05; t-test comparing starved control to fed control. Control flies have Or83b-Gal4 and UAS-GCaMP, and sNPFi flies also have UAS-sNPF-RNAi transgenes. DG, ORNs axon terminal calcium activity in response to electrical stimulation of the olfactory nerve before and after application of sNPF. D, Representative traces of fluorescence change over time from the DM1 glomerulus of fed and starved flies in saline and after addition of 10μM sNPF. E, Peak ΔF/F before and after sNPF. F, Percent increase in peak ΔF/F after exogenous sNPF addition in DM1. G, Percent increase in peak ΔF/F after sNPF addition in starved flies, for the five glomeruli that respond to cider vinegar. Stimulation was 1 ms in duration, 10 V in amplitude and 16 pulses at 100 Hz. n=5–6; error bars show SEM; *P<0.05, **P<0.01, ***P<0.001, t-test. The flies have Or83b-Gal4 and UAS-GCaMP, and UAS-sNPF-RNAi transgenes.
Figure 5
Figure 5. sNPF signaling in a single glomerulus is necessary for starvation-dependent food search
A, Two-photon imaging of ORN axon terminals in flies expressing RNAi to knockdown sNPF expression in the ORNs of individual glomeruli. Peak ΔF/F normalized to the average response from fed control flies to 0.2% SV cider vinegar. n=5–6. *P<0.05, t-test. All flies have Or83b-LexA and LexAop-GCaMP, and where indicated flies also have the Or-specific-Gal4 and UAS-sNPF-RNAi. B, The latency of food finding for starved flies expressing RNAi to knockdown sNPF or sNPFR1 in individual glomeruli. RNAi expression in only the DM1 glomerulus significantly decreases food finding. n=80–195 flies for each condition. *P<0.05, z-test for proportions comparing control to sNPFi and to sNPFRi. Error bars show SEM.
Figure 6
Figure 6. Overexpression of sNPFR1 is sufficient to enhance activity and food search behavior
A, Two-photon imaging of ORN axon terminals in the DM1 glomerulus of fed flies in response to 0.2% SV cider vinegar. Control flies have the Or83b-LexA and LexAop-GCaMP transgenes, and experimental flies also bear the Or42b-Gal4 and UAS-sNPFR1 transgenes. n=5–6, *P<0.05, t-test. B, The latency of food finding in fed flies. n=134–168, *P<0.05, z-test for proportions comparing overexpression flies to three controls. C, PN dendritic calcium in the DM1 glomerulus of fed flies in response to 0.2% SV cider vinegar. Control flies have GH146-LexA and LexAop-GCaMP and experimental flies also have Or42b-Gal4 and UAS-sNPF transgenes. n=5–6. D, The latency of food finding in fed flies. n=66–81. Error bars show SEM.
Figure 7
Figure 7. Insulin signaling modulates expression of sNPFR1 and olfactory sensitivity
A, Antennal tissue with immunoreactivity for the InR and GFP expression under the Or83b promoter. Tissue was stained with anti-GFP (green) and anti-InR (red) antibodies. B, Quantitative RT-PCR analysis of starvation-induced changes in mRNA expression in the antennae of control flies and flies expressing constitutively active InR (InR-CA) in ORNs (left), and that of flies fed PI3K antagonists relative to those fed only sucrose (right). C, Response to electrical stimulation of the olfactory nerve before and after bath application of 10 μM sNPF, as in those Figure 4D–G. n=6–9. D, PN dendritic response to 0.2% SV cider vinegar in the DM1 glomerulus for control flies and those expressing InR-CA in ORNs. n=5–9. C, D, Control flies contain GH146-LexA, LexAop-GCaMP, Or83b-Gal4; InR-CA flies also contain UAS-InR-CA. E, The latency of food search behavior in starved control flies (black and gray) and those expressing InR-CA in ORNs (blue). n=70–90 flies. F, PN dendritic response to 0.2% SV cider vinegar in the DM1 glomerulus for control flies fed sucrose overnight and those fed sucrose plus 25nM wortmannin or 30 μM LY294002. n=5 each. G, The latency of food search behavior in flies fed wortmannin and LY294002, and control flies fed sucrose only. sNPFRi flies (orange) contain both Or83b-Gal4 and UAS-sNPFR1-RNAi, while control flies (black or gray) represent combined data for flies expressing either transgene alone (control groups are not different from each other). n=60–92 flies. H, Model for starvation modulation of olfactory sensitivity. Error bars indicate SEM. *P<0.05, **P<0.01, ***P<0.001, t-test for B, C, D, F, and z-test for E, G.

Comment in

  • Hungry flies tune to vinegar.
    Huetteroth W, Waddell S. Huetteroth W, et al. Cell. 2011 Apr 1;145(1):17-8. doi: 10.1016/j.cell.2011.03.018. Cell. 2011. PMID: 21458663 Free PMC article.

References

    1. Arcaro A, Wymann MP. Wortmannin is a potent phosphatidylinositol 3-kinase inhibitor: the role of phosphatidylinositol 3,4,5-trisphosphate in neutrophil responses. Biochem J. 1993;296(Pt 2):297–301. - PMC - PubMed
    1. Barsh GS, Schwartz MW. Genetic approaches to studying energy balance: perception and integration. Nat Rev Genet. 2002;3:589–600. - PubMed
    1. Berthoud HR. Multiple neural systems controlling food intake and body weight. Neurosci Biobehav Rev. 2002;26:393–428. - PubMed
    1. Brown MR, Crim JW, Arata RC, Cai HN, Chun C, Shen P. Identification of a Drosophila brain-gut peptide related to the neuropeptide Y family. Peptides. 1999;20:1035–1042. - PubMed
    1. Carlsson MA, Diesner M, Schachtner J, Nassel DR. Multiple neuropeptides in the Drosophila antennal lobe suggest complex modulatory circuits. J Comp Neurol. 2010;518:3359–3380. - PubMed

Publication types

LinkOut - more resources