. 2011 Apr 1;145(1):145-58.
doi: 10.1016/j.cell.2011.03.012.

A rapid and scalable system for studying gene function in mice using conditional RNA interference

Affiliations

A rapid and scalable system for studying gene function in mice using conditional RNA interference

Prem K Premsrirut et al. Cell. .

Abstract

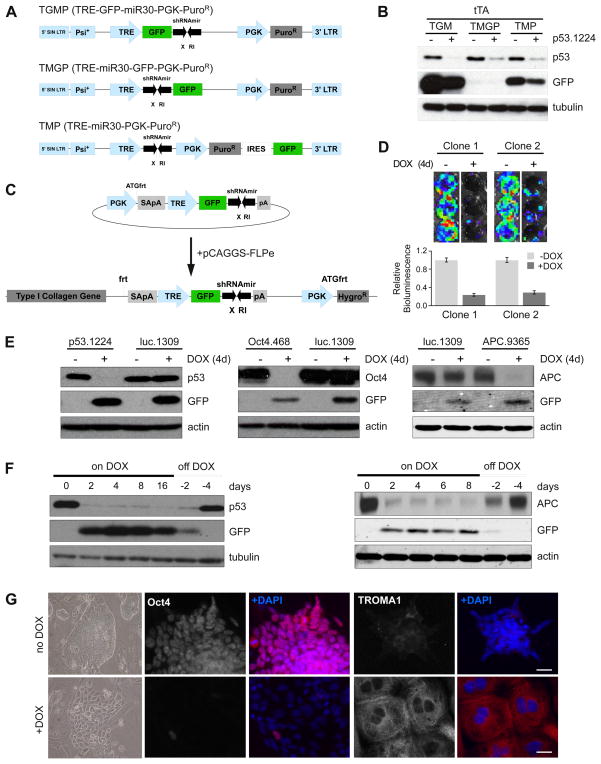
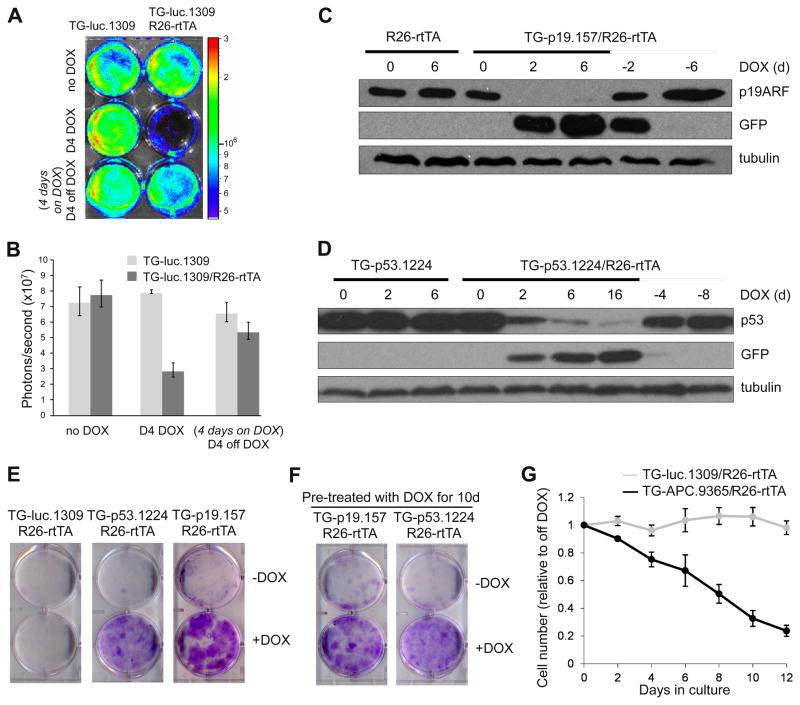
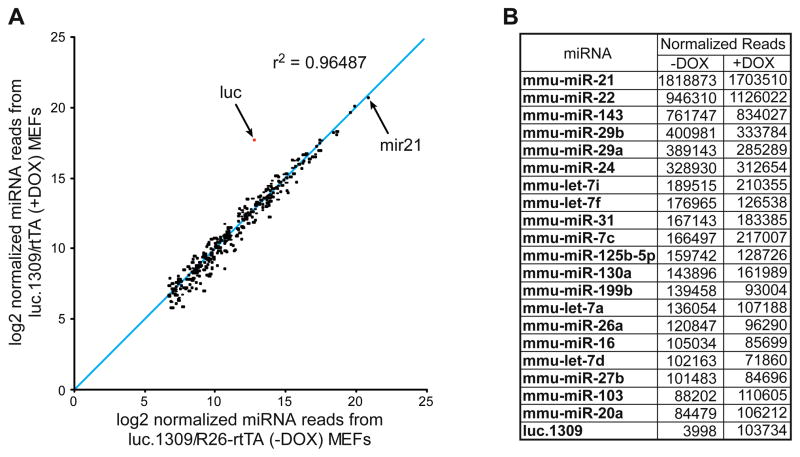
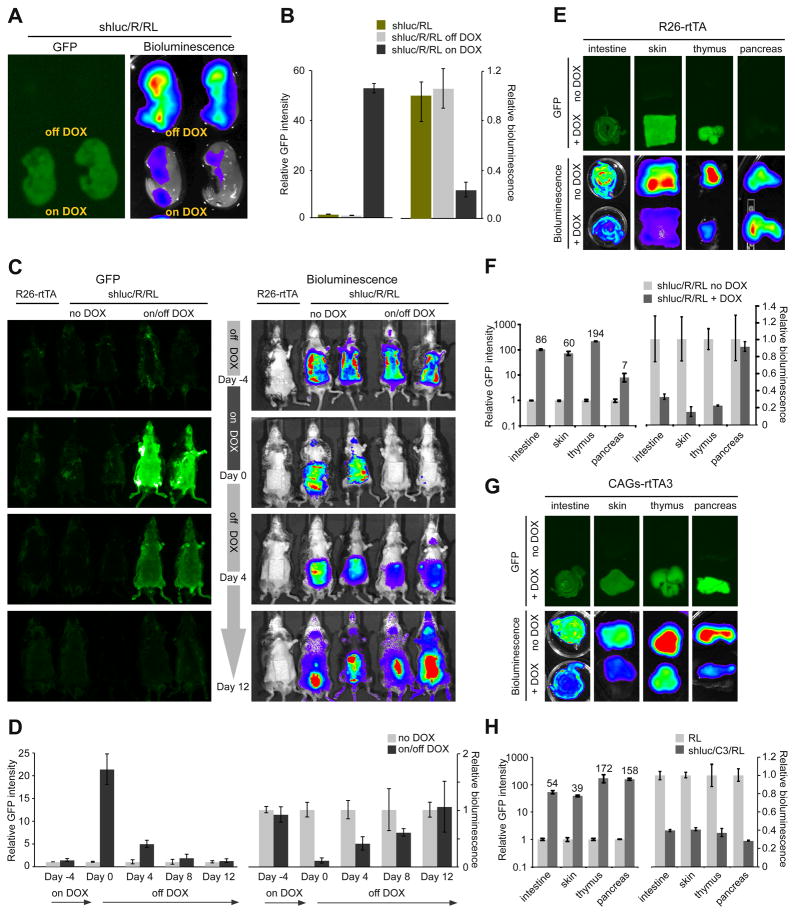
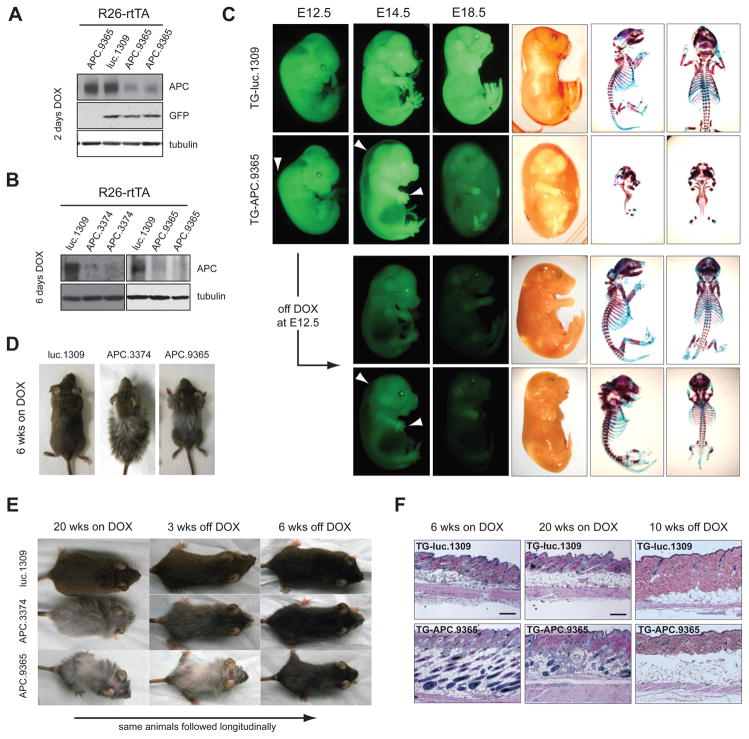
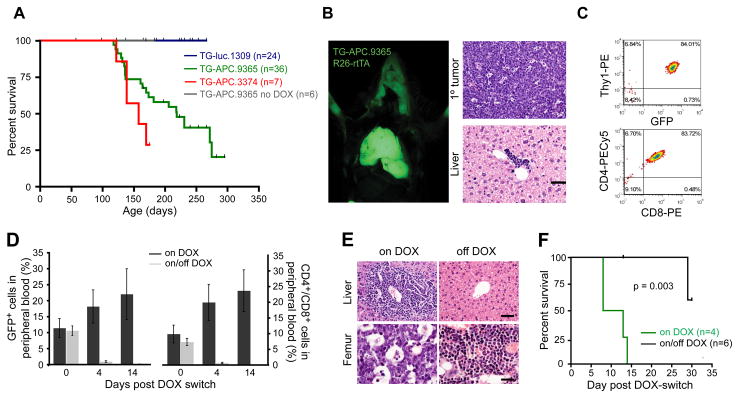
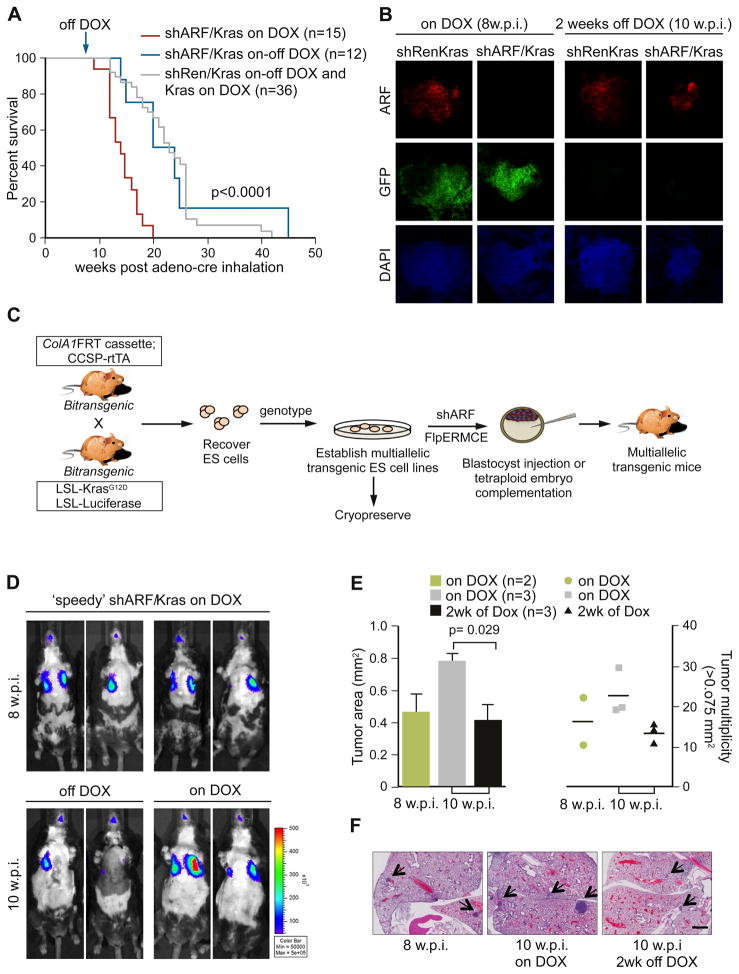
RNA interference is a powerful tool for studying gene function, however, the reproducible generation of RNAi transgenic mice remains a significant limitation. By combining optimized fluorescence-coupled miR30-based shRNAs with high efficiency ES cell targeting, we developed a fast, scalable pipeline for the production of shRNA transgenic mice. Using this system, we generated eight tet-regulated shRNA transgenic lines targeting Firefly and Renilla luciferases, Oct4 and tumor suppressors p53, p16(INK4a), p19(ARF) and APC and demonstrate potent gene silencing and GFP-tracked knockdown in a broad range of tissues in vivo. Further, using an shRNA targeting APC, we illustrate how this approach can identify predicted phenotypes and also unknown functions for a well-studied gene. In addition, through regulated gene silencing we validate APC/Wnt and p19(ARF) as potential therapeutic targets in T cell acute lymphoblastic leukemia/lymphoma and lung adenocarcinoma, respectively. This system provides a cost-effective and scalable platform for the production of RNAi transgenic mice targeting any mammalian gene. PAPERCLIP:


Figures

Figure 1
Figure 1. TRE-driven shRNAmirs targeted to the ColA1 locus can drive robust DOX-dependent gene knockdown in ES cells
(A) Schematic diagram comparing the TGMP, TMGP and TMP retroviral vectors. (B) Western blot analysis of p53.1224 infected tTA-expressing MEFs using TGMP, TMGP and TMP retroviral vectors. (C) Schematic diagram of the pColTGM vector. Coelectroporation of pColTGM and pCAGS-Flpe recombinase promotes integration and confers hygromycin resistance. (D) (Top) Representative luminescent images of two independent clones containing luc.1309/R26-rtTA. Cells were infected with MSCV-Luciferase and 48h post- infection cultured with or without DOX for 4 days. (Bottom) Quantification of luciferase activity. Error bars are SEM, n=2. (E) Western blot analyses of DOX-treated ES cell clones containing R26-rtTA and luc.1309, p53.1224, Oct4.468 or APC.9365. (F) Western blot analyses of p53.1224 and APC.9365 clones treated with DOX as indicated and then shifted to normal media for 2 or 4 days prior to harvest. (G) Brightfield and immunofluorescence images of Oct4.468/R26-rtTA cells treated with DOX for 7d. Cells were stained with antibodies as indicated. See also Figure S1
Figure 2
Figure 2. Reversible knockdown of gene targets in primary mouse embryonic fibroblasts derived from ColA1-TGM ES-cell derived mice
(A) Bioluminescence imaging of luc.1309 and luc.1309;R26-rtTA MEFs infected with MSCV-luciferase. MEFs were treated with DOX, then shifted into DOX-free media as indicated. (B) Quantification of the bioluminescence signal to assess luciferase knockdown. Error bars represent SEM, n=2. (C, D) Western blot analysis of MEFs harvested from a cross between C57BL/6 WT mice and p19.157;R26-rtTA or p53.1224;R26-rtTA founder mice, treated with DOX as indicated. (E) Colony formation assay of R26-rtTA MEFs containing either luc.1309, p53.1224 or p19.157 plated at low density and cultured with or without DOX for 12 days. (F) MEFs pre-treated with DOX for 10d were plated at low density and cultured with or without DOX for 12 days. (G) Proliferation of DOX-treated TG-luc.1309;R26-rtTA and TG-APC.9365;R26-rtTA MEFs relative to off-DOX populations. Error bars represent SEM, n=4. See also Figure S2.
Figure 3
Figure 3. Endogenous miRNA levels are unaffected by exogenous shRNA induction
(A) Scatter plot representing the normalized expression of the 319 most abundant miRNAs from DOX-treated and untreated TG-luc.1309/R26-rtTA MEFs. R2 correlation coefficient excludes TG-luc.1309 sequence reads. (B) Number of normalized reads obtained for the top 20 miRNAs and luc.1309 expressed in MEFs. See also Figure S3.
Figure 4
Figure 4. Reversible GFP-marked DOX-dependent knockdown in live animals
(A) GFP and bioluminescent images of E17.5 TG-luc.1309;R26-rtTA;Rosa-Luciferase (shluc/R/RL) embryos sacrificed from pregnant females treated with or without DOX. (B) Relative GFP intensity and (C) bioluminescence between shluc/RL and shluc/R/RL embryos. Error bars represent SEM, n=7. (D) In vivo bioluminescent time course imaging of TG-luc.1309;R26-rtTA;Rosa-Luciferase (shluc/R/RL) triple transgenics and controls. Animals were treated with or without DOX for 4 days, then removed from treatment. See also Figure S4
Figure 5
Figure 5. APC loss disrupts embryonic and postnatal development
(A) Western blot of whole protein lysates from E10.5 embryos on DOX for 2 days and(B) E14.5 embryos on DOX for 6 days. (C) GFP and brightfield images of embryos treated with DOX from E8.5 or pulsed with DOX from E8.5–E12.5. Arrows indicate fluid accumulation along the dorsal ridge and defects in limb and digit development at E12.5 and E14.5. Alcian blue and Alizarin red stained skeletons from E18.5 embryos. (D) Representative photographs of TG-luc.1309/R26-rtTA, TG-APC.3374/R26-rtTA and TG-APC.9365/R26-rtTA double transgenic mice on DOX for 6 weeks. (E). Representative photographs of Luc.1309, APC.3374 and APC.9365 treated with DOX for 20 weeks and then removed from DOX-treatment for 6 weeks. (F) H&E sections of skin taken from Luc.1309/R26-rtTA and TG-APC.9365/R26-rtTA double transgenic mice treated with DOX for 6 weeks, 20 weeks and 20 weeks on DOX/6 weeks off DOX as indicated. Scale bars are 100μm. See also Figure S5.
Figure 6
Figure 6. APC loss is required for the maintenance of T lymphoblastic leukemia/lymphoma
(A) Kaplan Meier analysis of R26-rtTA/TG-shRNA double transgenic mice treated continually with DOX from 4–6 weeks of age. (B) Fluorescent image of TG-APC.9365/R26-rtTA animals with GFP positive tumor in the thymus. All analyzed animals that became moribund developed T lymphoblastic leukemia/lymphoma apparent in the thymus, lymph nodes (not shown) and liver. Scale bars: 50μm (C) Representative flow cytometry plots of cells isolated from primary lymphomas and stained for surface markers: Thy1, CD4 and CD8 (D) GFP positive (left) and CD4/CD8 double positive cells in the peripheral blood of SCID mice transplanted with TG-APC.3374 lymphoma following the DOX-switch. Error bars = SEM. (E) H&E stained sections of the liver (upper) and bone marrow (femur – lower) in mice on DOX or removed from DOX for 2 weeks (off DOX). Scale bars: 50μm (liver) and 20μm (femur). (F) Kaplan Meier analysis of SCID mice transplanted with TG-APC.3374 primary lymphoma. Graph is plotted from the time of DOX-switch (5 weeks after transplant). See also Figure S6
Figure 7
Figure 7. Reversible suppression of ARF in a multi-allele disease model documents a contribution to tumor maintenance
(A) Kaplan Meier analysis of Kras, shRen/Kras and shARF/Kras treated with Adeno-Cre and DOX at 4-6 weeks. Cohorts were randomized and followed with or without DOX treatment, 8 w.p.i. (B) Confocal microscopy images of 150μm sections from lungs of shRen/Kras and shARF/Kras animals on DOX at 8 w.p.i. or off DOX for 2 weeks (10 w.p.i.). Sections were stained with an antibody to detect ARF and DAPI. Scale bar = 100μm. (C) The ‘speedy’ mouse workflow to derive and retarget multiallelic ES cell clones from intercrossed mice. (D) Bioluminescence images of shARF/Kras mice produced by the ‘speedy’ approach (C) and treated with Adeno-Cre and DOX at 5 weeks of age. At 8 w.p.i., cohorts were randomized and followed with or without DOX treatment for 2 weeks. (E) Quantification of lesions in the lungs of ‘speedy’ shARF/Kras mice at 8 and 10 w.p.i. For each animal, area and multiplicity represent the mean scored across 10 H&E stained sections taken at 100μm apart. Error bars represent SEM (left). (F) Representative H&E stained sections of the lungs from mice in (D,E). Arrows mark lesions scored. Scale bar = 1mm. See also Figure S7

Comment in

  • Animal models: mastering RNAi in mice.
    Flintoft L. Flintoft L. Nat Rev Genet. 2011 Jun;12(6):380. doi: 10.1038/nrg3004. Epub 2011 May 17. Nat Rev Genet. 2011. PMID: 21577222 No abstract available.
  • Speeding up RNAi.
    Pastrana E. Pastrana E. Nat Methods. 2011 May;8(5):374. doi: 10.1038/nmeth0511-374. Nat Methods. 2011. PMID: 21678621 No abstract available.

References

    1. Beard C, Hochedlinger K, Plath K, Wutz A, Jaenisch R. Efficient method to generate single-copy transgenic mice by site-specific integration in embryonic stem cells. Genesis. 2006;44:23–28. - PubMed
    1. Bryja V, Bonilla S, Arenas E. Derivation of mouse embryonic stem cells. Nature protocols. 2006;1:2082–2087. - PubMed
    1. Capecchi MR. Gene targeting in mice: functional analysis of the mammalian genome for the twenty-first century. Nat Rev Genet. 2005;6:507–512. - PubMed
    1. Clevers H. Wnt/beta-catenin signaling in development and disease. Cell. 2006;127:469–480. - PubMed
    1. Colnot S, Decaens T, Niwa-Kawakita M, Godard C, Hamard G, Kahn A, Giovannini M, Perret C. Liver-targeted disruption of Apc in mice activates beta-catenin signaling and leads to hepatocellular carcinomas. Proc Natl Acad Sci U S A. 2004;101:17216–17221. - PMC - PubMed

Publication types

MeSH terms