. 2011 Apr 6;13(4):413-427.
doi: 10.1016/j.cmet.2011.02.014.

TLE3 is a dual-function transcriptional coregulator of adipogenesis

Affiliations

TLE3 is a dual-function transcriptional coregulator of adipogenesis

Claudio J Villanueva et al. Cell Metab. .

Abstract

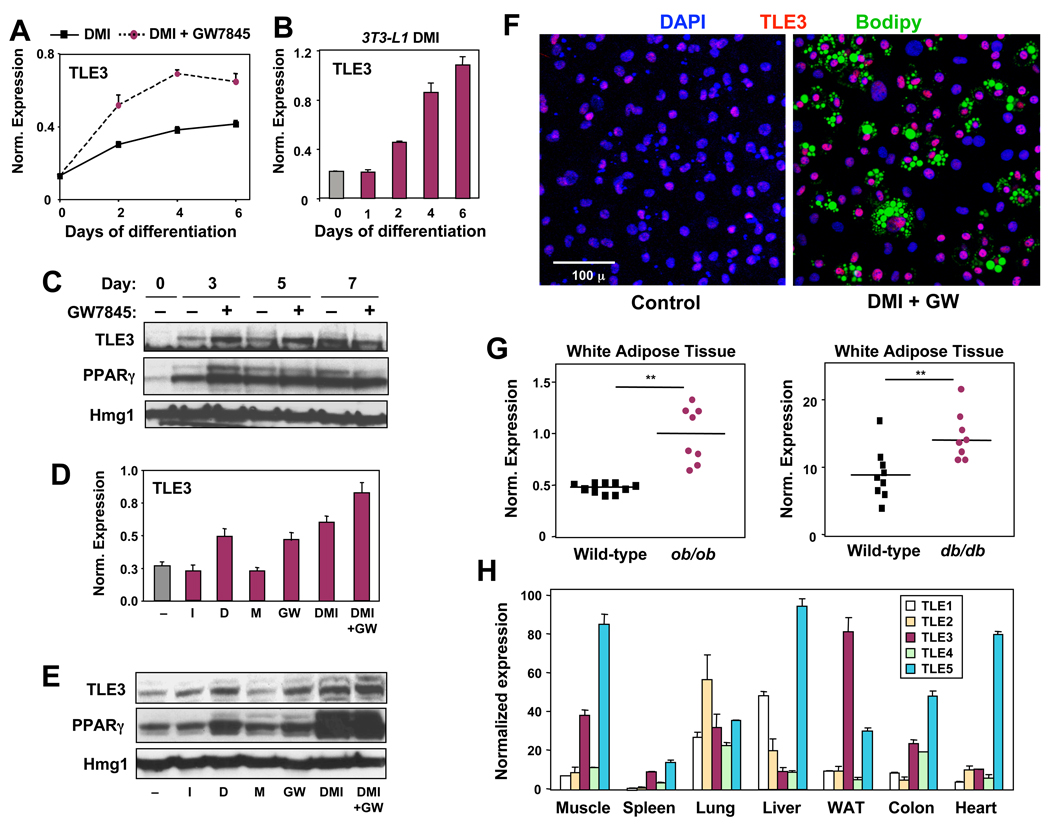
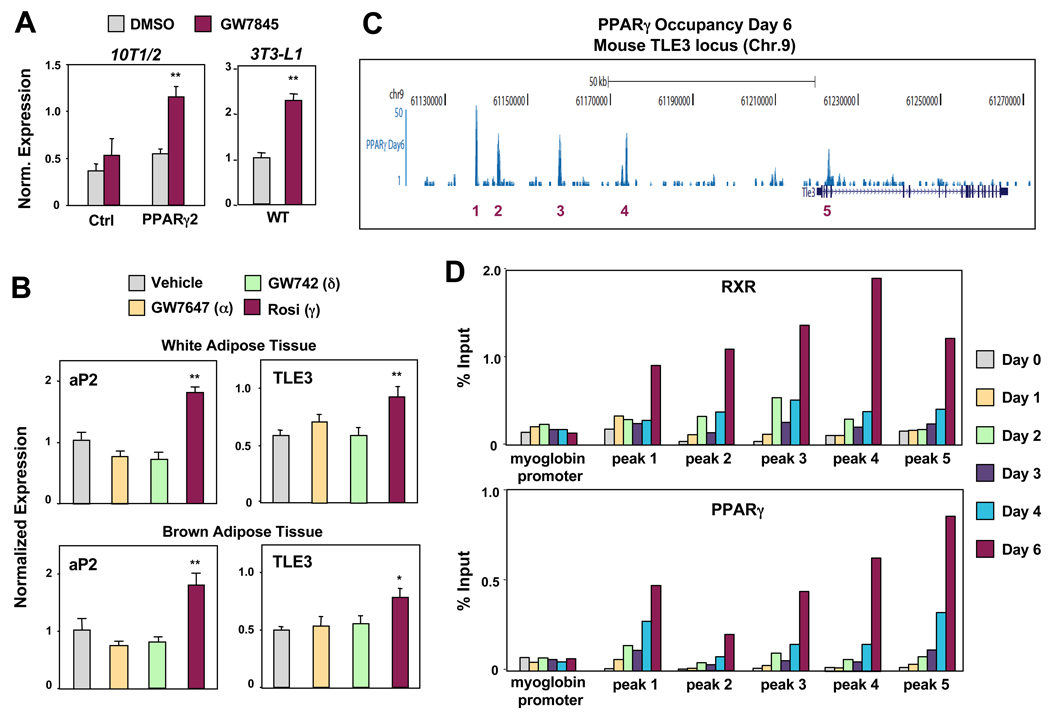
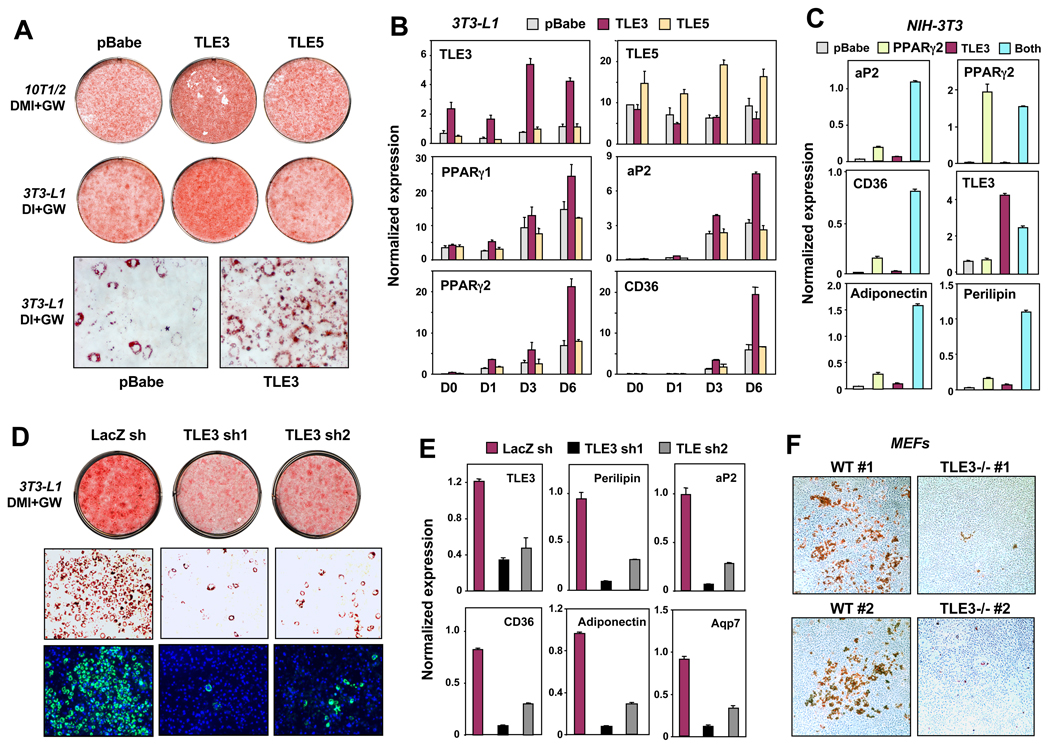
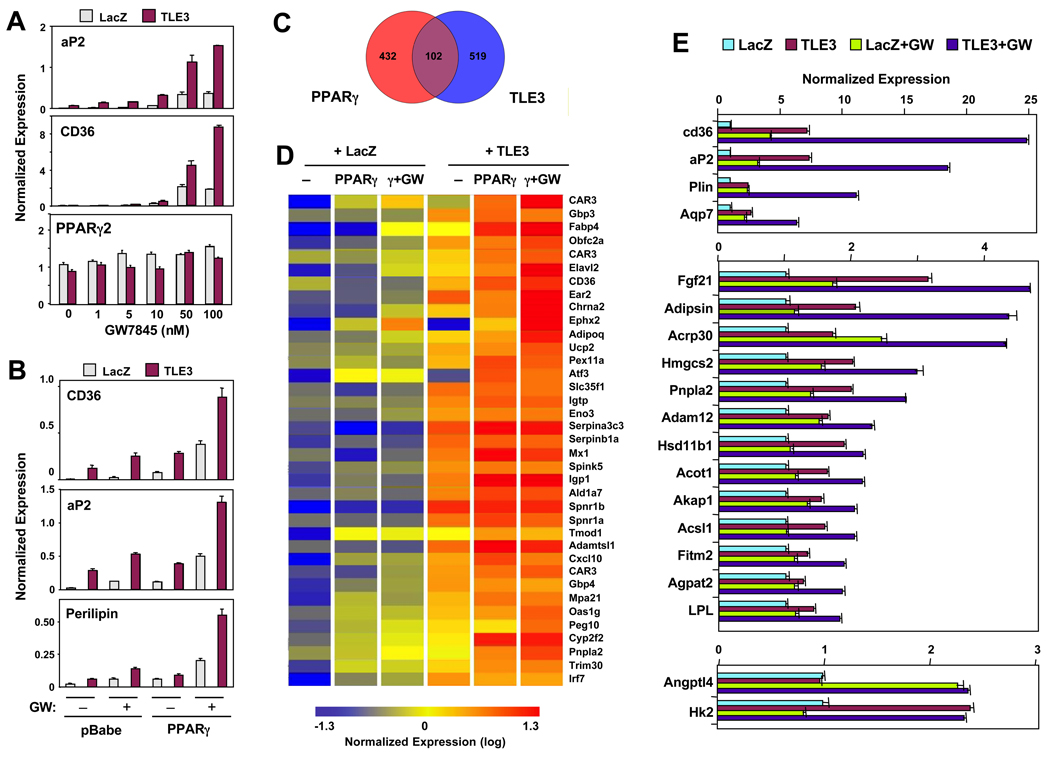
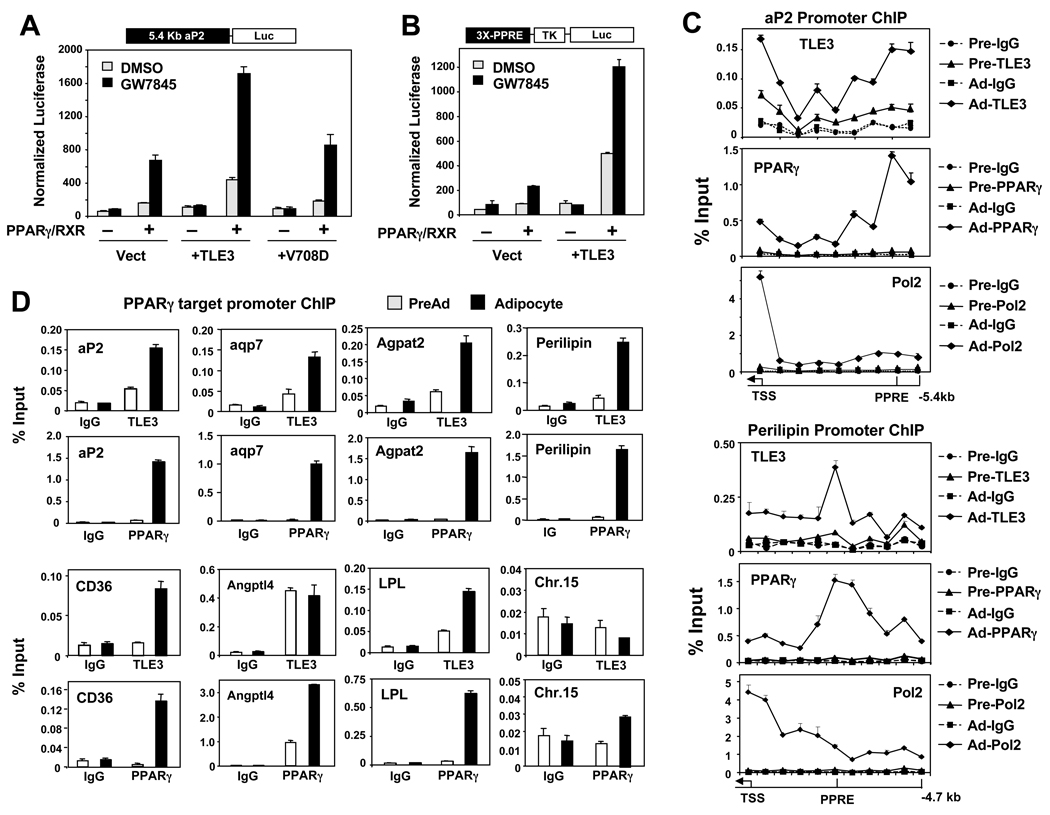
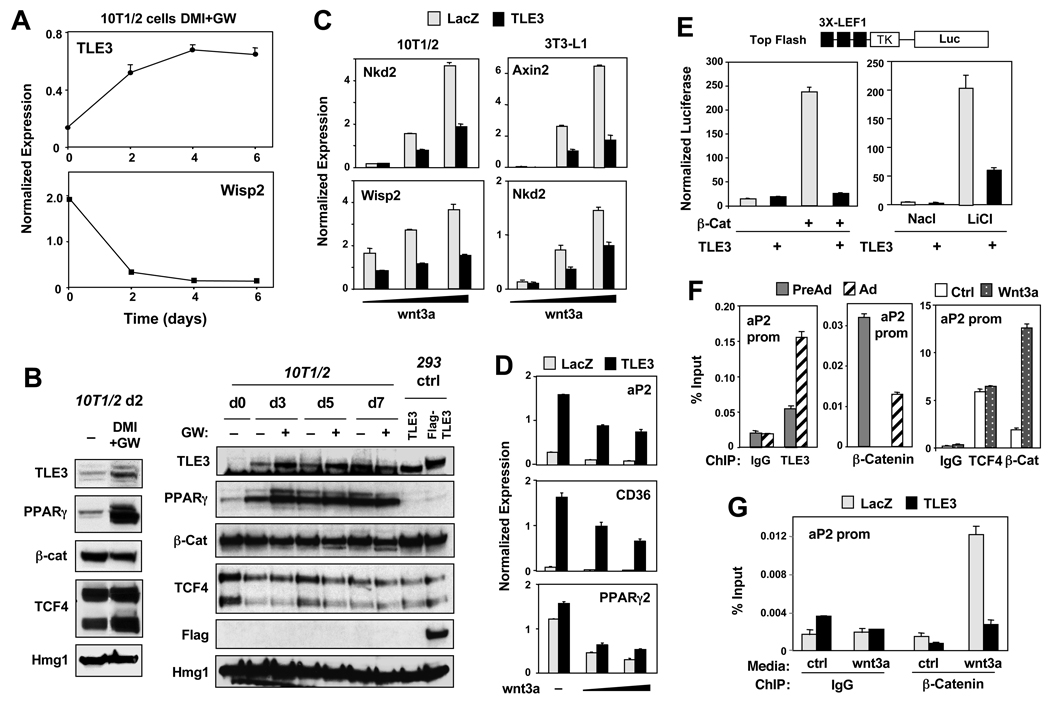
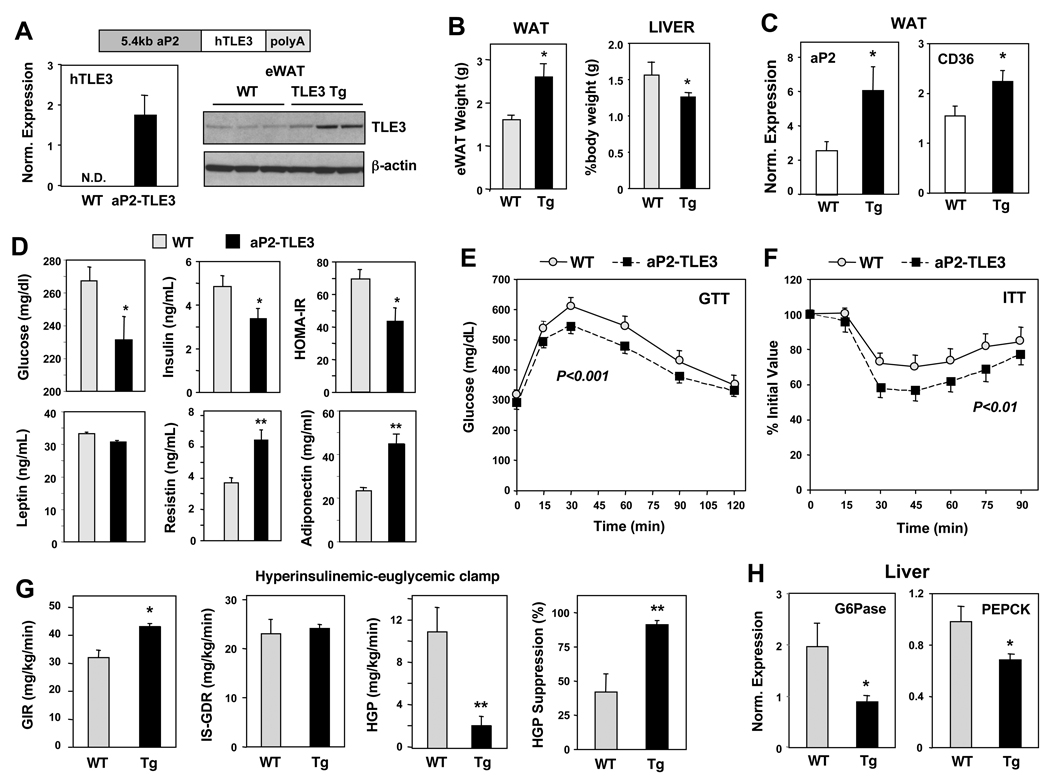
PPARγ and Wnt signaling are central positive and negative regulators of adipogenesis, respectively. Here we identify the groucho family member TLE3 as a transcriptional integrator of the PPARγ and Wnt pathways. TLE3 is a direct target of PPARγ that participates in a feed-forward loop during adipocyte differentiation. TLE3 enhances PPARγ activity and functions synergistically with PPARγ on its target promoters to stimulate adipogenesis. At the same time, induction of TLE3 during differentiation provides a mechanism for termination of Wnt signaling. TLE3 antagonizes TCF4 activation by β-catenin in preadipocytes, thereby inhibiting Wnt target gene expression and reversing β-catenin-dependent repression of adipocyte gene expression. Transgenic expression of TLE3 in adipose tissue in vivo mimics the effects of PPARγ agonist and ameliorates high-fat-diet-induced insulin resistance. Our data suggest that TLE3 acts as a dual-function switch, driving the formation of both active and repressive transcriptional complexes that facilitate the adipogenic program.


Figures

Fig 1
Fig 1. Regulation of TLE3 expression during adipocyte differentiation
(A) Realtime PCR analysis of TLE3 mRNA expression during differentiation of 10T1/2 cells treated with differentiation cocktail (DMI = 1 µM dexamethasone, 0.5 mM IBMX, 5 µg/ml insulin) or DMI and GW7845 (20 nM). mRNA expression in this and all subsequent figures was normalized to 36B4 control. (B) TLE3 mRNA expression during differentiation of 3T3-L1 preadipocyte differentiation. Cells were treated as in A. (C) Immunoblot analysis of TLE3 protein expression in 10T1/2 cells treated with DMI plus DMSO (−) or DMI plus GW7845 (20 nM). (D) Realtime PCR analysis of TLE3 mRNA expression in 10T1/2 cells treated for 2 d with individual components of the differentiation cocktail. D, 1 µM dexamethasone; M, 0.5 mM IBMX; I, 5 µg/ml insulin; GW, 20 nM GW7845. (E) Immunoblot analysis of total cell lysates from cells treated as in (D). (F) TLE3 expression visualized by fluorescent confocal microscopy in undifferentiated (control) and differentiating (DMI + 20 nM GW for 4 d) 10T1/2 cells. TLE3 (red) colocalizes with DAPI (blue) staining nuclei, with highest expression observed in bodipy-staining (green) adipocytes. (G) Realtime PCR analysis of TLE3 mRNA expression in epididymal white adipose tissue from ob/ob and db/db mice. N = 8–10 per group, ** P<0.01. (H) Realtime PCR analysis of the relative tissue distribution of mRNAs encoding murine TLE (1–5) family members. Error bars represent mean +/− S.D. See also Figure S1.
Fig 2
Fig 2. TLE3 is a PPARγ target gene
(A) Realtime PCR analysis of TLE mRNA expression in PPARγ2-expressing 10T1/2 preadipocytes treated with 100 nM GW7845 for 2 d (left) and 3T3-L1 preadipocytes treated with DMI + 20 nM GW for 2 d (right). (B) Induction of TLE3 and aP2 mRNA by PPARγ agonist in white and brown adipose tissue in vivo. Mice were gavaged twice daily for 2 d with vehicle, PPARα agonist (10 mg/kg GW7647), PPARδ (10 mg/kg GW742) agonist, or PPARγ agonist (30 mg/kg rosiglitazone). Male mice, n = 10 per group, * P<0.05, ** P<0.01. (C) High-resolution ChIP-Seq analysis of PPARγ bindings sites within the mouse TLE3 locus from 3T3-L1 cells differentiated for 6 d with DMI. These data are from the deep sequencing study of Nielsen et al. (2008). (D) Differentiation dependent PPARγ/RXR occupancy in the vicinity of the TLE3 gene. ChIP of PPARγ and RXR in 3T3-L1 cells was followed by qPCR analysis using primers flanking individual PPARy bindings sites in the TLE3 gene region at the indicated time points. A region of the myoglobin promoter served as a negative control. Error bars represent mean +/− S.D. See also Fig. S2.
Fig 3
Fig 3. TLE3 is a transcriptional modulator of adipogenesis
(A) Analysis of differentiation by oil red-O (ORO) staining of retrovirally-derived stable 10T1/2 and 3T3-L1 cell lines expressing vector, TLE3 or TLE5. 10T1/2 and 3T3-L1 cells were stimulated to differentiate with DMI + 20 nM GW for 7 d and 10 d, respectively. Top: plate view of ORO stained cultures; bottom: microscopic view. (B) Realtime PCR analysis of adipogenic gene expression in 3T3-L1 cells transduced with TLE3 or TLE5. (C) NIH-3T3 cells stably expressing TLE3, PPARγ or both from retroviral vectors were stimulated to differentiate with dexamethasone (2 µM), insulin (5 µg/ml) and GW7845 (20 nM) for 10 d. (D) Adipogenic potential of 3T3-L1 cells expressing lentivirally-delivered shRNAs targeting TLE3 or LacZ shRNA control. Infected 3T3-L1 cells were stimulated to differentiate with DMI + 10 nM GW for 7d. Top: plate view of ORO stained cultures; Middle: microscopic view; bottom: microscopic view of Bodipy (lipid) and DAPI (nuclei) stained cells. (E) Expression of PPARγ target genes in 3T3-L1 cells expressing TLE3 shRNAs as determined by realtime PCR. Cells were treated with DMI+GW (10 nM) for 7d. (F) Adipogenic potential of individually-derived primary WT or TLE3 null mouse embryonic fibroblasts (MEFs). Cells were stained with ORO after stimulation with DMI + 1 µM rosiglitazone for 6 d, followed by 6 d with rosiglitazone and insulin. Error bars represent mean +/− S.D. See also Fig. S3.
Fig 4
Fig 4. Overlapping transcriptional profiles of PPARγ and TLE3 regulated genes
(A) Confluent 10T1/2 cells expressing the coxsackie adenovirus receptor (CAR) were infected with LacZ-or TLE3-expressing adenoviruses and simultaneously treated with GW7845 at the indicated concentrations for 48 h. Gene expression was determined by realtime PCR. (B) Effects of TLE3 expression on adipogenic genes are dependent on the level PPARγ expression. Postconfluent 10T1/2 CAR cells stably expressing vector (pBabe) or PPARγ2 were infected overnight with LacZ or TLE3 expressing adenovirus. 48 h post infection cells were treated with DMSO or 10 nM GW7845. (C) Venn diagram of overlapping transcriptional programs of PPARγ and TLE3 in 10T1/2 cells. (D) Heatmap representation of selected PPARγ and TLE3-responsive genes (> 1.4 change) identified by analysis of Affymetrix arrays. (E) Validation of gene expression changes from microarray analysis by realtime PCR. PPARγexpressing 10T1/2 cells infected with LacZ or TLE3 adenovirus were treated with DMSO or 10 nM GW7845 for 24 h. Error bars represent mean +/− S.D. See also Fig. S4.
Fig 5
Fig 5. TLE3 coactivates PPARγ-dependent gene expression
(A) Analysis of −5.4kb aP2 enhancer activation by coexpression of PPARγ/RXR and TLE3 or TLE3 carrying a mutation in the WD40 (V708D) domain in undifferentiated 10T1/2 cells treated with DMSO or 100 nM GW7845. (B) TLE3 enhances PPARγ/RXR activation of a luciferase reporter driven by minimal PPAR responsive elements (3X-PPRE). Cells were treated as in (A). (C) Differentiation-dependent recruitment of TLE3 to the endogenous aP2 and perilipin promoters in 10T1/2 cells. ChIP assays were carried out using TLE3, PPARγ, RNA Pol2, and control IgG in preadipocytes (Pre) and adipocytes (day 6 DMI + 20nM GW; Ad). Individual regions of the aP2 and perilipin upstream regions from the (TSS) to 5.4 kb upstream and 4.7 kb upstream were amplified by realtime PCR, respectively. (D) ChIP analysis of TLE3 recruitment to the PPREs of PPARγ target gene promoters in differentiated adipocytes. A non-specific region in Chr. 15 was used as a control. ChIP signals were quantified by realtime PCR. Error bars represent mean +/− S.D. See also Fig. S5.
Fig 6
Fig 6. TLE3 counteracts Wnt repression of adipocyte promoters through corepression of TCF4
(A) Realtime PCR analysis of mRNA expression in 10T1/2 cells induced to differentiate with DMI and GW7845. (B) Immunoblot analysis of 10T1/2 cells stimulated to differentiate with DMI −/20 nM GW as indicated. (C) Undifferentiated 10T1/2 and 3T3-L1 cells stably expressing CAR were infected with LacZ or TLE3 adenovirus overnight. Cells were treated 2 d post infection with control or Wnt3a conditioned media for 24 h. Gene expression was determined by realtime PCR. (D) 10T1/2 cells were transduced with control or TLE3 adenovirus vectors and treated for 24 h with Wnt-conditioned media. Gene expression was determined by realtime PCR. (E) Effect of TLE3 transfection on activation of the Wnt-responsive Top-Flash reporter by β-catenin (left) and GSK-3β inhibitor LiCl (25 mM for 24 h) (Right) in 293T cells. (F) Reciprocal occupancy of β-catenin and TLE3 on the aP2 promoter. ChIP assays of aP2 promoter binding were carried out for TLE3, TCF4 and β-catenin in pre-adipocytes (Pre-Ad) and adipocytes (Ad). (G) 10T/12 cells stably expressing CAR were infected overnight with LacZ or TLE3 adenovirus. 48 h post-infection cells were treated with control or Wtn3a conditioned media for 24 h. ChIP assays were carried out using control IgG and β-catenin antibodies. Note, the data for TLE3 in A and B are the same as shown in Figure 1 and are included here for comparison. Error bars represent mean +/− S.D. See also Fig. S6.
Fig 7
Fig 7. Transgenic expression of TLE3 in adipose tissue ameliorates insulin resistance
(A) Expression of TLE3 in epididymal WAT of aP2-TLE3 transgenic mice. Left: realtime PCR analysis of human TLE3 transcript; right: immunoblot analysis of TLE3 and β-actin. Chow-fed C57BL6 male mice, N = 3 per group. (B) Weight of eWAT and liver % of body mass in high-fat fed WT and aP2-TLE3 (Tg) transgenic mice. 14 weeks HF-diet, N = 6 per group, * P<0.05. (C) Realtime PCR analysis of aP2 and CD36 expression in eWAT from 14 week HF-fed mice. N=5–6 per group, * P<0.05. (D) Plasma glucose, insulin, leptin, resistin, and adiponectin levels from mice fed high-fat diet for 11-weeks. Homeostatic model assessment-insulin resistance (HOMA-IR) index was computed from glucose and insulin values. 6 h fasting, N = 5–6 per group, * P<0.05. (E and F) Glucose tolerance test (GTT) and insulin tolerance test (ITT) wa performed after 6-weeks and 9-weeks of HF-diet, respectively. N = 5–6 per group. P values were determined by 2-way ANOVA followed by Bonferroni post-hoc test. (G) Improved insulin sensitivity and reduced hepatic glucose production in aP2-TLE3 transgenic mice. Glucose infusion rate (GIR), insulin-stimulated glucose disposal (IS-GDR) and hepatic glucose production (HGP) was determined by hyperinsulinemic euglycemic clamp studies of 14-week HF-fed mice WT and aP2-TLE3 mice. N =5–6 per group, * P<0.05, ** P<0.01. (H) Reduced expression of the gluconeogenic enzymes glucose-6-phosphatase (G-6-Pase) and PEPCK determined by realtime PCR analysis of livers from 14-week HF fed mice. N = 5–6 per group, * P<0.05. Error bars represent mean +/− S.D. See also Fig. S7.

References

    1. Arango NA, Szotek PP, Manganaro TF, Oliva E, Donahoe PK, Teixeira J. Conditional deletion of beta-catenin in the mesenchyme of the developing mouse uterus results in a switch to adipogenesis in the myometrium. Dev Biol. 2005;288:276–283. - PubMed
    1. Bennett CN, Ross SE, Longo KA, Bajnok L, Hemati N, Johnson KW, Harrison SD, MacDougald OA. Regulation of Wnt signaling during adipogenesis. J Biol Chem. 2002;277:30998–31004. - PubMed
    1. Buscarlet M, Stifani S. The 'Marx' of Groucho on development and disease. Trends Cell Biol. 2007;17:353–361. - PubMed
    1. Cavallo RA, Cox RT, Moline MM, Roose J, Polevoy GA, Clevers H, Peifer M, Bejsovec A. Drosophila Tcf and Groucho interact to repress Wingless signalling activity. Nature. 1998;395:604–608. - PubMed
    1. Chen G, Courey AJ. Groucho/TLE family proteins and transcriptional repression. Gene. 2000;249:1–16. - PubMed

Publication types

MeSH terms

LinkOut - more resources