. 2011 Apr 6;13(4):450-460.
doi: 10.1016/j.cmet.2011.03.013.

PARP-2 regulates SIRT1 expression and whole-body energy expenditure

Affiliations

PARP-2 regulates SIRT1 expression and whole-body energy expenditure

Péter Bai et al. Cell Metab. .

Abstract

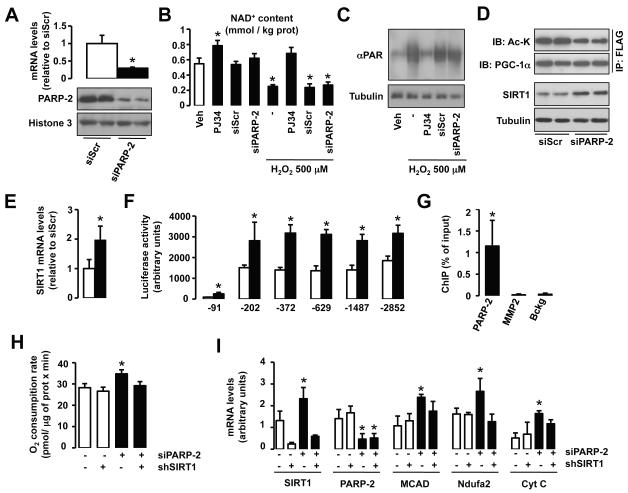
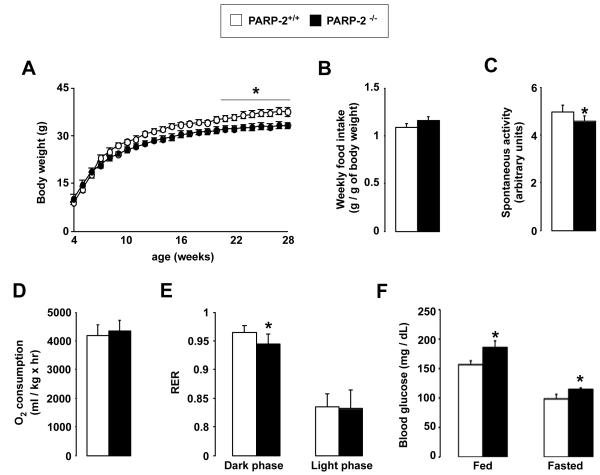
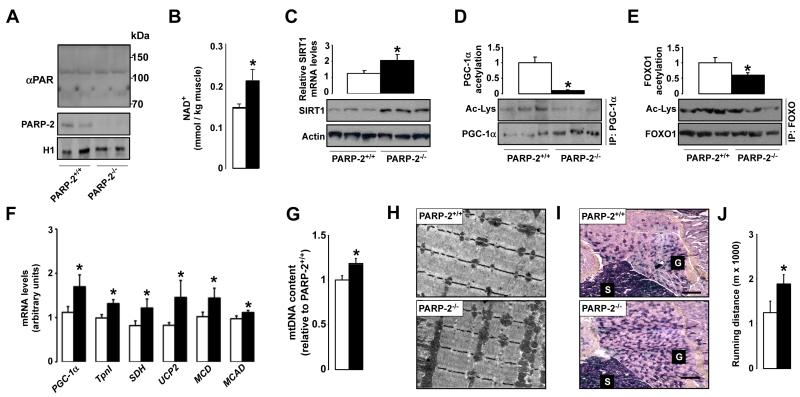
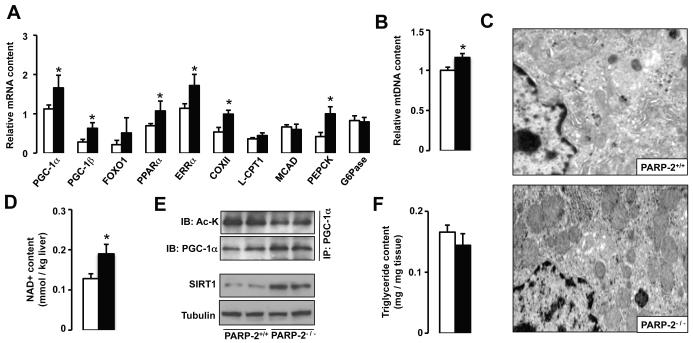
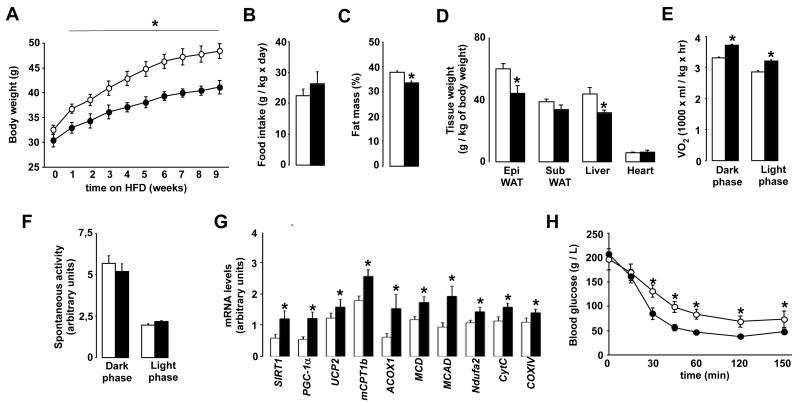
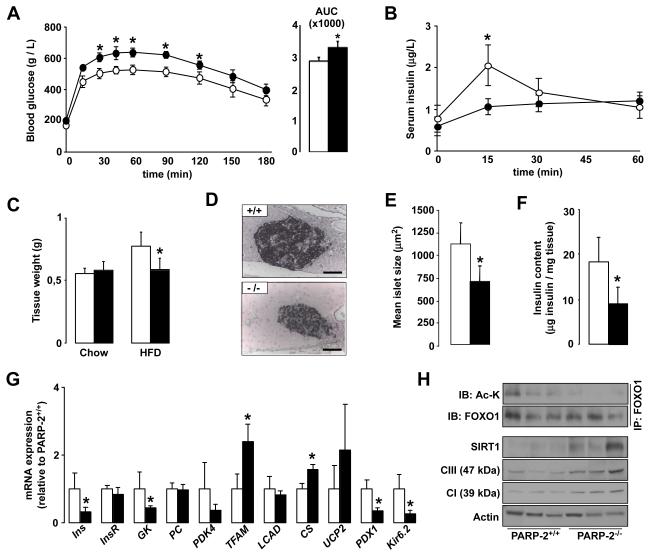
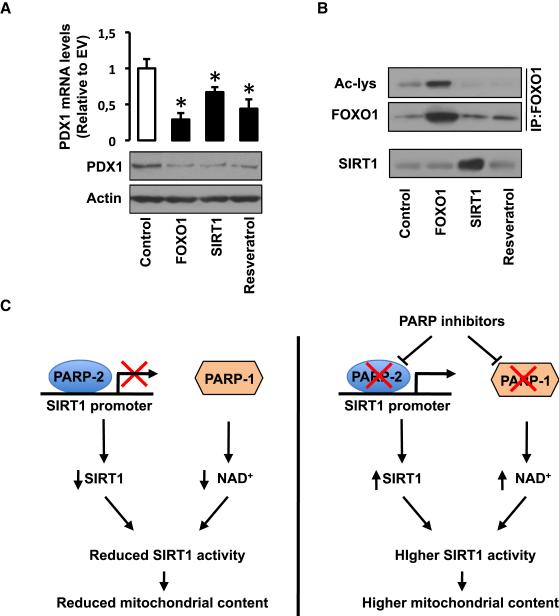
SIRT1 is a NAD(+)-dependent enzyme that affects metabolism by deacetylating key transcriptional regulators of energy expenditure. Here, we tested whether deletion of PARP-2, an alternative NAD(+)-consuming enzyme, impacts on NAD(+) bioavailability and SIRT1 activity. Our results indicate that PARP-2 deficiency increases SIRT1 activity in cultured myotubes. However, this increase was not due to changes in NAD(+) levels, but to an increase in SIRT1 expression, as PARP-2 acts as a direct negative regulator of the SIRT1 promoter. PARP-2 deletion in mice increases SIRT1 levels, promotes energy expenditure, and increases mitochondrial content. Furthermore, PARP-2(-/-) mice were protected against diet-induced obesity. Despite being insulin sensitized, PARP-2(-/-) mice were glucose intolerant due to a defective pancreatic function. Hence, while inhibition of PARP activity promotes oxidative metabolism through SIRT1 activation, the use of PARP inhibitors for metabolic purposes will require further understanding of the specific functions of different PARP family members.


Figures

Fig.1
Fig.1. PARP-2 regulates oxidative metabolism by acting as a transcriptional repressor of SIRT1
(A) PARP-2 protein and mRNA levels were analyzed in C2C12 myotubes carrying a stably transfected scramble or PARP-2 shRNA. (B) NAD+ content was evaluated in C2C12 myotubes treated with PJ34 (24 hrs, 1 mM) or carrying a stable transfection of a scramble or a PARP-2 shRNA. H2O2 treatment was performed for 1 hr. (C) Total protein extracts from C2C12 mytotubes treated as in (B) were used to test total PARylation (D) Scramble or PARP-2 shRNA were stably transfected in C2C12 myotubes that were infected with FLAG-PGC-1α. After 48 hr, total protein extracts were obtained and used for FLAG immunoprecipitation and to test the markers indicated. (E) SIRT1 mRNA levels were analyzed in C2C12 myotubes carrying a stable transfection with either scramble or a PARP-2 siRNA. (F) The activity of nested deletions of the SIRT1 promoter was measured after PARP-2 depletion in C2C12 cells. (G) The presence of PARP-2 on the SIRT1 (−1 - −91) and K19 promoter was assessed in C2C12 cells by ChIP assays. (H-I) O2 consumption (H) and mRNA levels of the markers indicated (I) were measured in C2C12 myotubes carrying a stable transfection with either a scramble (−) or a PARP-2 (+) shRNA and infected with adenovirus encoding for either a scramble (−) or a SIRT1 (+) shRNA. Unless otherwise indicated, white bars represent scramble shRNA transfected myotubes and black bars represent PARP-2 shRNA transfected myotubes. All results are expressed as mean ± SD. * indicates statistical difference vs. PARP-2+/+ mice at p<0.05
Fig. 2
Fig. 2. General physiologic characteristics of PARP-2−/− mice
(A) PARP-2+/+ and −/− male mice (n=15/13) were weighed weekly and (B) food consumption was measured. (C-E) PARP-2+/+ and −/− male mice on a chow diet (n=6/6, age of 3 months) were subjected to indirect calorimetry, where (C) locomotor activity, (D) O2 consumption and (E) RER were determined. (F) Fed and fasted blood glucose levels. * indicates statistical difference vs. PARP-2+/+ mice at p<0.05
Fig.3
Fig.3. PARP-2−/− muscles have higher SIRT1 activity, mitochondrial content and oxidative profile
(A) PARylation and PARP-2 levels in gastrocnemius muscle were determined by western blot. PARP-2 levels were determined in nuclear extracts, and histone 1 (H1) was used as loading control. (B) NAD+ levels in gastrocnemius muscle of 4-months old PARP-2+/+ and −/− male mice (n=4 and 8, respectively) were determined by HPLC/MS (C) SIRT1 mRNA and protein levels were determined in total muscle mRNA or protein extracts. (D) PGC-1α and (E) FOXO1 acetylation lysine levels were examined after immunoprecipitation. Quantifications are shown on top of the respective images. (F) Gene expression of the indicated genes in the gastrocnemius muscle of PARP-2+/+ and −/− mice was evaluated by RT-qPCR. (G) Quantification of mitochondrial DNA by qPCR (H) Transmission electron micrographs and (I) SDH staining of representative gastrocnemius muscle sections show increased mitochondrial content (PARP-2+/+ and −/− male mice n=15 and 13, respectively; age of 7 months). Scale bar in (I) = 100 μm (J) Endurance treadmill test was performed as described. White bars represent PARP-2+/+ mice, while black bars represent PARP-2−/− mice. * indicates statistical difference vs. PARP-2+/+ mice at p<0.05
Fig.4
Fig.4. PARP-2−/− mice display higher mitochondrial content in liver
(A) mRNA expression analysis in livers from PARP-2+/+ and −/− male (n=16/13, respectively; 6 months of age) mice fed a chow diet. (B) Relative liver mitochondrial DNA (mtDNA) content was estimated by RT-qPCR. (C) Transmission electron microscopic images of liver sections demonstrate higher mitochondrial number in PARP-2−/− mice. (D) Total intrahepatic NAD+ content was measured by HPLC/MS. (E) Total liver protein extracts were used to evaluate SIRT1 protein levels and immunoprecipitate PGC-1α to examine PGC-1α acetylation levels. (F) Liver triglyceride content was estimated after methanol/chloroform lipid extraction as described. White bars represent PARP-2+/+ mice, while black bars represent PARP-2−/− mice. * indicates statistical difference vs. PARP-2+/+ mice at p<0.05
Fig.5
Fig.5. PARP-2−/− mice are protected against diet-induced body weight gain and insulin resistance
(A) 6 month old PARP-2+/+ and −/− male mice (n= 7 and 9, respectively) fed on high fat diet were weighed weekly (B) Food intake was monitored during high-fat feeding. (C) Body fat mass composition was evaluated through EchoMRI. (D) The weight of the tissues indicated was determined upon autopsy at the end of the high-fat feeding period. (E) VO2 and (F) spontaneous activity was determined by indirect calorimetry. Quantification of the mean values during light and dark phases are shown. (G) mRNA expression levels in gastrocnemius muscles from PARP-2+/+ and −/− mice after 12 weeks of high-fat diet was determined by qRT-PCR (H) Glucose excursion after an intraperitoneal insulin tolerance test. White bars and circles represent PARP-2+/+ mice, while black bars and circles represent PARP-2−/− mice. * indicates statistical difference vs. PARP-2+/+ mice at p<0.05
Fig.6
Fig.6. Pancreatic abnormalities render PARP-2−/− mice glucose intolerant after high-fat feeding
(A) Plasma glucose levels during an intraperitoneal glucose tolerance test (IPGTT) in 9-month old PARP-2+/+ and −/− male mice (n=7 and 9, respectively) fed a high fat diet for 12 weeks. The area under the curve of the glucose curves is shown at the right. (B) Insulin levels during the first hour of the IPGTT in (A). (C) Comparison of total pancreas weight between PARP-2+/+ and PARP-2−/− mice on chow and high-fat diet. (D) Pancreas from PARP-2+/+ and PARP-2−/− mice after high-fat diet were stained for insulin (scale bar = 50 μm) and (E) Mean islet size was quantified. (F) Total insulin content in pancreas was measured as described. (G) Gene expression in the pancreas of PARP-2+/+ and PARP-2−/− mice was measured by RT-qPCR. (H) Pancreatic total protein extracts were used to test the abundance of SIRT1, and subunits from the respiratory complexes I and III. FOXO1 was also immunoprecipitated to determine relative FOXO1 acetylation levels. Through the figure, white bars and circles represent PARP-2+/+ mice, while black bars and circles represent PARP-2−/− mice. * indicates statistical difference vs. PARP-2+/+ mice at p<0.05
Figure 7
Figure 7. Increased SIRT1/FOXO1 function reduces pdx1 expression
(A-B) MIN6 cells were transfected with either empty vector (Control), human FLAG-FOXO1 or human FLAG-SIRT1. Additionally, one empty vector group was treated with resveratrol (50 mM, 5 hrs per day for 2 days). Then, total protein and RNA extracts were obtained to test (A) pdx1 mRNA and protein levels, (B) total FOXO1 and acetylated FOXO1 levels, as well as SIRT1 levels. (C) Scheme illustrating how the activation of PARP enzymes can downregulate SIRT1 function through different means. On one hand, PARP-1 activation limits SIRT1 activity by decreasing NAD+ bioavailability and, on the other, we now report how PARP-2 acts as a negative regulator of the SIRT1 promoter. The PARP-1 and PARP-2 knock-out mouse models indicate that PARP inhibition can be a useful to promote SIRT1 activity and enhance mitochondrial content. This strategy might be exploited therapeutically in the context of metabolic disease, commonly linked to impaired mitochondrial content or function.

Comment in

References

    1. Ame JC, Rolli V, Schreiber V, Niedergang C, Apiou F, Decker P, Muller S, Hoger T, Menissier-de Murcia J, de Murcia G. PARP-2, A novel mammalian DNA damage-dependent poly(ADP-ribose) polymerase. J.Biol.Chem. 1999;274:17860–17868. - PubMed
    1. Bai P, Houten SM, Huber A, Schreiber V, Watanabe M, Kiss B, de Murcia G, Auwerx J, Menissier-de Murcia J. Poly(ADP-ribose) polymerase-2 controls adipocyte differentiation and adipose tissue function through the regulation of the activity of the retinoid × receptor/peroxisome proliferator-activated receptor-gamma heterodimer. J.Biol.Chem. 2007;282:37738–37746. - PubMed
    1. Bai P, Canto C, Oudart H, Brunyánszki A, Cen Y, Thomas C, Yamamoto H, Huber A, Kiss B, Houtkooper RH, Schoonjans K, Schreiber V, Sauve AA, Menissier de Murcia J, Auwerx J. PARP-1 inhibition increases mitochondrial metabolism through SIRT1 activation. Cell Metabolism. 2011:XXX. - PMC - PubMed
    1. Banks AS, Kon N, Knight C, Matsumoto M, Gutierrez-Juarez R, Rossetti L, Gu W, Accili D. SirT1 gain of function increases energy efficiency and prevents diabetes in mice. Cell Metab. 2008;8:333–341. - PMC - PubMed
    1. Brunet A, Sweeney LB, Sturgill JF, Chua KF, Greer PL, Lin Y, Tran H, Ross SE, Mostoslavsky R, Cohen HY, Hu LS, Cheng HL, Jedrychowski MP, Gygi SP, Sinclair DA, Alt FW, Greenberg ME. Stress-dependent regulation of FOXO transcription factors by the SIRT1 deacetylase. Science. 2004;303:2011–2015. - PubMed

Publication types

LinkOut - more resources