A fluorescent reporter of AMPK activity and cellular energy stress
- PMID: 21459332
- PMCID: PMC3070961
- DOI: 10.1016/j.cmet.2011.03.006
A fluorescent reporter of AMPK activity and cellular energy stress
Abstract
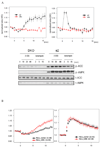
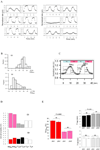
AMP-activated protein kinase (AMPK) is activated when the AMP/ATP ratio in cells is elevated due to energy stress. Here, we describe a biosensor, AMPKAR, that exhibits enhanced fluorescence resonance energy transfer (FRET) in response to phosphorylation by AMPK, allowing spatiotemporal monitoring of AMPK activity in single cells. We show that this reporter responds to a variety of stimuli that are known to induce energy stress and that the response is dependent on AMPK α1 and α2 and on the upstream kinase LKB1. Interestingly, we found that AMPK activation is confined to the cytosol in response to energy stress but can be observed in both the cytosol and nucleus in response to calcium elevation. Finally, using this probe with U2OS cells in a microfluidic device, we observed a very high cell-to-cell variability in the amplitude and time course of AMPK activation and recovery in response to pulses of glucose deprivation.
Copyright © 2011 Elsevier Inc. All rights reserved.
Figures


Similar articles
-
AMPK Causes Cell Cycle Arrest in LKB1-Deficient Cells via Activation of CAMKK2.Mol Cancer Res. 2016 Aug;14(8):683-95. doi: 10.1158/1541-7786.MCR-15-0479. Epub 2016 May 2. Mol Cancer Res. 2016. PMID: 27141100 Free PMC article.
-
Hypoxia triggers AMPK activation through reactive oxygen species-mediated activation of calcium release-activated calcium channels.Mol Cell Biol. 2011 Sep;31(17):3531-45. doi: 10.1128/MCB.05124-11. Epub 2011 Jun 13. Mol Cell Biol. 2011. PMID: 21670147 Free PMC article.
-
Regulation of AMP-activated protein kinase by LKB1 and CaMKK in adipocytes.J Cell Biochem. 2011 May;112(5):1364-75. doi: 10.1002/jcb.23053. J Cell Biochem. 2011. PMID: 21312243
-
AMP-activated protein kinase in skeletal muscle: from structure and localization to its role as a master regulator of cellular metabolism.Cell Mol Life Sci. 2008 Nov;65(23):3737-55. doi: 10.1007/s00018-008-8244-6. Cell Mol Life Sci. 2008. PMID: 18810325 Free PMC article. Review.
-
AMP-activated protein kinase in metabolic control and insulin signaling.Circ Res. 2007 Feb 16;100(3):328-41. doi: 10.1161/01.RES.0000256090.42690.05. Circ Res. 2007. PMID: 17307971 Review.
Cited by
-
Multi-scale computational study of the Warburg effect, reverse Warburg effect and glutamine addiction in solid tumors.PLoS Comput Biol. 2018 Dec 7;14(12):e1006584. doi: 10.1371/journal.pcbi.1006584. eCollection 2018 Dec. PLoS Comput Biol. 2018. PMID: 30532226 Free PMC article.
-
Genetically encoded fluorescent sensors reveal dynamic regulation of NADPH metabolism.Nat Methods. 2017 Jul;14(7):720-728. doi: 10.1038/nmeth.4306. Epub 2017 Jun 5. Nat Methods. 2017. PMID: 28581494 Free PMC article.
-
Deletion of CaMKK2 from the liver lowers blood glucose and improves whole-body glucose tolerance in the mouse.Mol Endocrinol. 2012 Feb;26(2):281-91. doi: 10.1210/me.2011-1299. Epub 2012 Jan 12. Mol Endocrinol. 2012. PMID: 22240810 Free PMC article.
-
Lipid metabolism disturbances and AMPK activation in prolonged propofol-sedated rabbits under mechanical ventilation.Acta Pharmacol Sin. 2012 Jan;33(1):27-33. doi: 10.1038/aps.2011.155. Epub 2011 Dec 12. Acta Pharmacol Sin. 2012. Retraction in: Acta Pharmacol Sin. 2012 Aug;33(8):1100. doi: 10.1038/aps.2012.113. PMID: 22158109 Free PMC article. Retracted.
-
Illuminating the kinome: Visualizing real-time kinase activity in biological systems using genetically encoded fluorescent protein-based biosensors.Curr Opin Chem Biol. 2020 Feb;54:63-69. doi: 10.1016/j.cbpa.2019.11.005. Epub 2020 Jan 3. Curr Opin Chem Biol. 2020. PMID: 31911398 Free PMC article. Review.
References
-
- Allen MD, Zhang J. Subcellular dynamics of protein kinase A activity visualized by FRET-based reporters. Biochem Biophys Res Commun. 2006;348:716–721. - PubMed
-
- Budinger GR, Chandel N, Shao ZH, Li CQ, Melmed A, Becker LB, Schumacker PT. Cellular energy utilization and supply during hypoxia in embryonic cardiac myocytes. Am J Physiol. 1996;270:L44–L53. - PubMed
-
- Cohen-Saidon C, Cohen AA, Sigal A, Liron Y, Alon U. Dynamics and variability of ERK2 response to EGF in individual living cells. Mol Cell. 2009;36:885–893. - PubMed
Publication types
MeSH terms
Substances
Grants and funding
LinkOut - more resources
Full Text Sources
Other Literature Sources
Research Materials

