. 2011 Nov;21(11):2482-97.
doi: 10.1093/cercor/bhr020. Epub 2011 Mar 31.

Saccade-related modulations of neuronal excitability support synchrony of visually elicited spikes

Affiliations

Saccade-related modulations of neuronal excitability support synchrony of visually elicited spikes

Junji Ito et al. Cereb Cortex. 2011 Nov.

Abstract

During natural vision, primates perform frequent saccadic eye movements, allowing only a narrow time window for processing the visual information at each location. Individual neurons may contribute only with a few spikes to the visual processing during each fixation, suggesting precise spike timing as a relevant mechanism for information processing. We recently found in V1 of monkeys freely viewing natural images, that fixation-related spike synchronization occurs at the early phase of the rate response after fixation-onset, suggesting a specific role of the first response spikes in V1. Here, we show that there are strong local field potential (LFP) modulations locked to the onset of saccades, which continue into the successive fixation periods. Visually induced spikes, in particular the first spikes after the onset of a fixation, are locked to a specific epoch of the LFP modulation. We suggest that the modulation of neural excitability, which is reflected by the saccade-related LFP changes, serves as a corollary signal enabling precise timing of spikes in V1 and thereby providing a mechanism for spike synchronization.


Figures
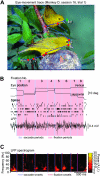
Figure 1.
Figure 1.
Eye movements and V1 activity during free viewing of a natural image. (A) Trace of eye movements of monkey D on 1 of 13 presented images. Red dots indicate fixation positions and blue curves represent the traces of saccadic eye movements. Green dots indicate the initial (Ini) and final (Fin) eye positions in this trial. (B) Traces of the horizontal and vertical eye positions (top) are shown together with the simultaneously recorded single unit spike trains of 10 neurons (middle) and an LFP trace (3–100 Hz; bottom) from one of the tetrodes. Periods of fixations and saccades are indicated by red and blue shaded areas, respectively. Fixation periods are numbered according to the order of their occurrence so that they correspond to the numbers in (A). (C) Spectrogram (in a frequency range from 5 to 95 Hz) of the LFP trace shown in (B) calculated using the wavelet transform. The onsets of fixations and saccades are indicated by red and blue vertical lines, respectively. The power is given in arbitrary units.
Figure 2.
Figure 2.
Spiking and LFP activities related to eye-event onsets during free viewing of natural images. Panels (A,C,E) and (B,D,F) show data of monkey D and S, respectively. (A,B) Mean firing rates triggered on fixation-onset (red) and saccade-onset (blue), estimated using a Gaussian kernel (standard of 4 ms). The color-shaded areas represent ±2 standard error of the mean (s.e.m.) of the respective signals. Spike data from all S–F trials and all recording sessions are combined. For better comparison, we plot saccade-onset–triggered and fixation-onset–triggered averages on a common time axis (here in relation to fixation-onset). Therefore, saccade-onset–triggered averages are shifted backwards in time by the median saccade duration (31 ms for monkey D and 33 ms for monkey S). Red and blue vertical lines indicate fixation-onset and typical saccade-onset timing, respectively. The significance of the difference between the peak responses of the 2 average rate profiles was assessed by testing if the mean of the trial-wise difference is significantly larger than zero (paired 2-tailed t-test). The 2 peak amplitudes were taken at time points 72 ms (A) and 74 ms (B) (black dashed lines) derived as the peak of the fixation-onset–triggered mean of the firing rate profiles. “n.s.” indicates a nonsignificant difference. (C,D) LFP averages triggered on fixation-onset (red) and saccade-onset (blue). The color-shaded areas represent ±2 s.e.m. of the respective signals. The temporal alignment is the same as in (A,B). The significance of the trial-wise differences between the amplitudes of the first peaks of the 2 signals is derived by a 2-tailed t-test (as in A,B). The amplitude is taken at 40 ms (C) and 37 ms (D) (black dashed lines), which correspond to the peak position of the average LFP signals. “***” indicates that the 2 signals were significantly different with a P value smaller than 0.0001. (E,F) Phase consistency values of LFPs across S–F trials in the frequency range of 3–100 Hz (y-axis) as a function of time relative to fixation-onset (x-axis).
Figure 3.
Figure 3.
Saccade duration–resolved averages of LFP and firing rate during free viewing of natural images. Panels (A,C) and (B,D) show data of monkey D and monkey S, respectively. (A,B) Top: grand average LFP calculated from all S–F trials irrespective of the duration of saccades. Bottom: saccade duration–resolved average LFP (color coded). The LFP averages triggered on fixation-onset are calculated separately for subsets of S–F trials that fall within a 10-ms window of saccade duration. The x-axis represents time relative to fixation-onset, the y-axis represents the mean saccade duration of the S–F trials that contributed to the average at the corresponding vertical position. A histogram of the saccade durations (bin width: 2 ms) is shown to the right in each panel. Fixation-onset and saccade-onset times are marked by magenta and cyan lines, respectively. For better visibility, LFP signals were preprocessed with a band-pass filter (±0.2·fc [Hz]) centered at the main frequency component fc of the response activity (16 Hz for monkey D and 13 Hz for monkey S) before averaging. (C,D) Saccade duration–resolved mean firing rate displayed in the same manner as for (A,B).
Figure 4.
Figure 4.
Firing rates and LFP activities related to eye-event onsets in the blank condition. The figure is organized in the same way as Figure 2, except for the gray curves in (AD) that show the results for the image condition (fixation-onset–triggered average for firing rates and saccade-onset–triggered average for LFPs) for a better comparison.
Figure 5.
Figure 5.
Firing rates and LFP activities related to eye-event onsets in the blank condition, calculated for the fixations around the center of the monitor screen and close to its edge. For the selection of center fixations and edge fixations, we sorted the S–F trials in the descending order of the distance between their fixation position and the nearest monitor edge. The fixations comprising the top and the bottom quartiles were selected as the center fixations and the edge fixations, respectively. (A,B) Mean firing rate triggered on fixation-onset, obtained from edge fixations (pink) or from center fixations (cyan). The color-shaded areas represent ±2 s.e.m. of the respective signals. For comparison, the mean firing rates from the image condition are also shown (gray dashed). However, for better comparison of the modulation of the responses in the different conditions, we shifted the firing rates from the image condition by a vertical offset such that their value at time 0 (i.e., fixation-onset) is equal to those of the edge fixations (pink). (C,D) LFP averages triggered on saccade-onset (time is shifted by median saccade duration as in Fig. 2). Color convention is same as for (A,B).
Figure 6.
Figure 6.
Schematic illustration of phase-locking analysis and generation of surrogate data. (A) Each row sketches data from one S–F trial around fixation-onset (dashed vertical line): LFP (black curve) and a simultaneously recorded spike train (vertical ticks). The phase-locking analysis is illustrated here for first spikes per trial (red ticks). To calculate the PLV, the LFP phases at spike times (red dots) are averaged by circular statistics (bottom panel). The length of the obtained average vector (red arrow) represents the empirical PLV. For illustration, the PLV is here computed within the prespecified time window (yellow area). For a time resolved phase–locking analysis, the window is slid in time and the PLV is calculated at each window position. To derive the locking tendency of all spikes within the window, the PLV may also be calculated on their basis (including the black spikes). (B) Illustration of the generation of the surrogate data for the significance test of the PLV. To estimate the PLV expected from independent LFP and spike signals, the spike trains are randomly shuffled across the S–F trials (pink arrows). The extracted phase values (blue dots) from these newly combined spikes and LFP signals serve to compute the surrogate PLV calculated in the same manner as for the original data.
Figure 7.
Figure 7.
Phase locking of spikes of individual neurons to LFP modulations during fixation periods. Panels (A,C,D,E,F) and (B,G,H,I,J) show data of monkey D and S, respectively. (A,B) Spike histograms of different sets of spikes aligned to fixation-onset (bin width: 5 ms). The histogram of all spikes (ALL, green) is a binned and rescaled version of the mean firing rate in Figure 2. The histogram of the first spikes (1ST, red) represents the time-resolved counts of the first spikes occurring in each trial after fixation-onset. Correspondingly, the other histogram represents the counts of the second spikes (2ND, blue) in each trial after fixation-onset. The saccade-onset–triggered average LFP is also shown (gray curve, arbitrary units) to illustrate the temporal relationship between the spiking activities and the LFP. (C,G) PLV for respective sets of spikes (the same color convention as in (A,B)). PLVs are calculated within a time interval encompassing the largest changes in LFP and firing rate (yellow marked area in (A,B); for its definition, see Materials and Methods). To the right of each PLV is the mean of the surrogate PLVs (cyan) with the bar representing the 95 percentile of the surrogate PLV distribution. (*p < 0.05, **p < 0.01, and ***p < 0.001.) (D,H) Period histograms of ALL spikes (left) and 1ST spikes (right) represented as a probability density function (p.d.f.). Cyan lines show the p.d.fs. of the corresponding surrogates. (E,I) Significance of the PLVs shown in (C,G) expressed in terms of the SM. Color convention is same as in (A,B) and (C,G). Dashed lines indicate the significance levels with different P values. (F,J) Comparison of the SMs for 1ST and 2ND spikes to the SMs for randomly resampled surrogate subsets of ALL spikes. The size (i.e., the number of spikes) of the surrogate subsets was matched to the size of 1ST or 2ND spikes. Green bars and the associated error bars represent the median and the 95 percentile of the SMs for the resampled ALL spikes, respectively.
Figure 8.
Figure 8.
Time-resolved analysis of phase locking. Panels (A,C) and (B,D) show data of monkey D and monkey S, respectively. (A,B) PLV of the first spikes as a function of time relative to fixation-onset. PLVs calculated from the real data (red trace) are plotted with the PLVs form surrogate data, shown with the median value (cyan curve) and the 95 percentile of the PLV distribution (cyan area) at each time point. (C,D) Time-resolved SM of the PLV for the first (red), second (blue), and all (green spikes in the image condition). The dotted horizontal lines indicate different significance levels (2-tailed). All calculations were done in a sliding window manner with a time window of 20-ms width.
Figure 9.
Figure 9.
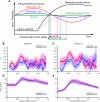
Influence of LFP amplitude on spike time precision. (A) Proposed model to account for spike timing precision based on the LFP modulation. Modulations of the field potentials are assumed to correlate with changes in the effective firing threshold of neurons (colored curves). Different levels of LFP amplitude modulation are shown in colors (red, blue, and green). 2 different temporal profiles of neuronal activation by sensory input are depicted as a black and gray curve. The crossing point of a neuronal activation curve with the effective firing threshold defines the time of the firing of the first spike (triangular marks on the time axis). The temporal jitter of the first spikes induced by different strength of neuronal activation depends on the amplitude of the threshold modulation. (BE) Test of the model in experimental data (left column: monkey D, right column: monkey S). Fixation-triggered S–F trials were separated into 2 groups according to the amplitude of the first positive peak of the LFP response (50% largest [red] vs. 50% smallest [blue]) and were analyzed separately. The time resolved mean phase–locking value (B,C) and the time-dependent mean firing rate (D,E) are shown for the 2 groups. The shaded area in (B,C) represents 95% confidence interval of the PLV estimated by the trial shuffling method. The shaded areas in (D,E) represent ±2 s.e.m. of the respective signals.
Figure 10.
Figure 10.
Temporal relationship between LFP, firing rate, and UE rate. Red solid and blue dashed curves in the top panel represent saccade-onset–triggered average LFP and its 1ST temporal derivative (dashed blue), respectively. The pink vertical line indicates the position of the negative peak of the derivative, which corresponds to the steepest negative slope of the LFP. It coincides with the peak of excess spike synchrony between neurons, measured as UE rate (bottom panel) as predicted by our model. The UE peak precedes the peak of the firing rates of the neurons but coincides with the timing of the fastest rate increase (middle panel).

References

    1. Abeles M. Role of the cortical neuron: integrator or coincidence detector? Isr J Med Sci. 1982;18:83–92. - PubMed
    1. Alonso JM, Usrey WM, Reid RC. Precisely correlated firing in cells of the lateral geniculate nucleus. Nature. 1996;383:815–819. - PubMed
    1. Bartlett JR, Doty RW, Lee BB, Sr, Sakakura H. Influence of saccadic eye movements on geniculostriate excitability in normal monkeys. Exp Brain Res. 1976;25:487–509. - PubMed
    1. Berens P, Keliris GA, Ecker AS, Logothetis NK, Tolias AS. Feature selectivity of the gamma-band of the local field potential in primate primary visual cortex. Front Neurosci. 2008;2:199–207. - PMC - PubMed
    1. Bosman CA, Womelsdorf T, Desimone R, Fries P. A microsaccadic rhythm modulates gamma-band synchronization and behavior. J Neurosci. 2009;29:9471–9480. - PMC - PubMed

Publication types