. 2011 Apr 1;25(7):679-84.
doi: 10.1101/gad.2036011.

Genome-wide analysis of 5-hydroxymethylcytosine distribution reveals its dual function in transcriptional regulation in mouse embryonic stem cells

Affiliations

Genome-wide analysis of 5-hydroxymethylcytosine distribution reveals its dual function in transcriptional regulation in mouse embryonic stem cells

Hao Wu et al. Genes Dev. .

Abstract

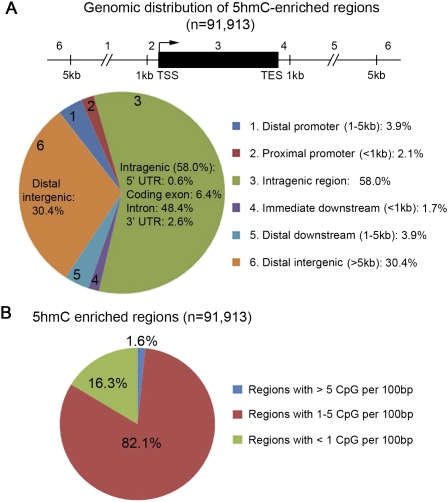
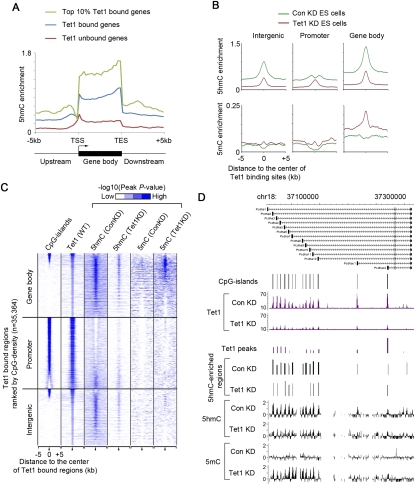
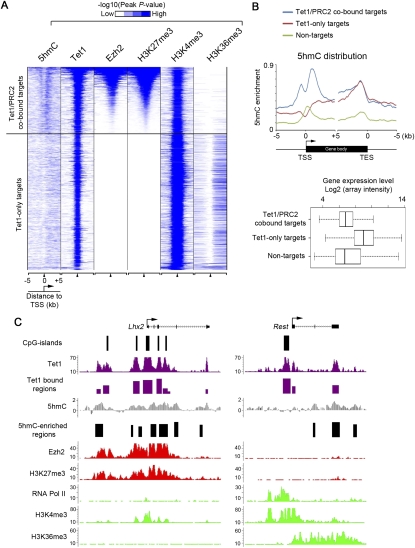
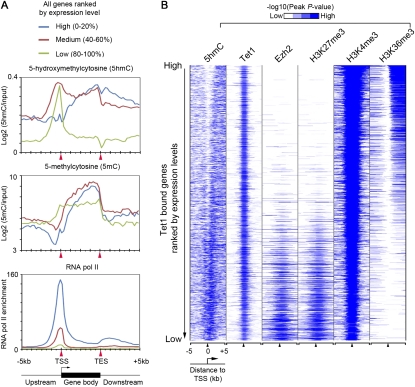
Recent studies have demonstrated that the Ten-eleven translocation (Tet) family proteins can enzymatically convert 5-methylcytosine (5mC) to 5-hydroxymethylcytosine (5hmC). While 5mC has been studied extensively, little is known about the distribution and function of 5hmC. Here we present a genome-wide profile of 5hmC in mouse embryonic stem (ES) cells. A combined analysis of global 5hmC distribution and gene expression profile in wild-type and Tet1-depleted ES cells suggests that 5hmC is enriched at both gene bodies of actively transcribed genes and extended promoter regions of Polycomb-repressed developmental regulators. Thus, our study reveals the first genome-wide 5hmC distribution in pluripotent stem cells, and supports its dual function in regulating gene expression.


Figures

Figure 1.
Figure 1.
Genomic distribution of 5hmC in mouse ES cells. (A) Genomic distribution of 5hmC-enriched regions ([−log10 peak P-value] > 2.3) relative to University of California at San Diego RefSeq genes (NCBI build 36). The genome-wide 5hmC occupancy was determined by whole-genome tiling microarray analysis. (B) Proportion of 5hmC-enriched regions with different CpG densities. Note that 5hmC is enriched at genomic regions with moderate-density CpG dinucleotides.
Figure 2.
Figure 2.
Tet1 is required for maintaining 5hmC levels at defined genomic regions in ES cells. (A) Distribution of 5hmC relative to all annotated genes in ES cells. Averaged 5hmC enrichment (measured by −log10 peak P-value) in 200-base-pair (bp) bins upstream of/downstream from gene bodies or at 5% intervals within the gene body is shown along the transcription units from 5 kb upstream of TSSs to 5 kb downstream from the transcriptional end sites (TESs). Note that 5hmC levels are generally enriched in Tet1-bound genes as compared with Tet1-unbound genes. (B) Changes in 5hmC and 5mC enrichment (measured by −log10 peak P-value) in response to Tet1 knockdown are shown for Tet1-bound regions associated with different genomic features (gene body, intergenic region, and promoter [2 kb flanking TSSs]). (C) Heat map representation of CpG islands and occupancy of Tet1, 5mC, and 5hmC in mouse ES cells at all Tet1-enriched regions (5 kb flanking the center of Tet1 peaks). The heat map is rank-ordered by CpG density of genomic regions within 500 bp flanking the center of Tet1 peaks. The enrichment of 5hmC and 5mC was determined by whole-genome tiling microarrays. Tet1-bound regions at gene bodies, promoters, and intergenic regions are shown separately. The enrichment of Tet1 binding was determined previously by ChIP-seq analyses (Wu et al. 2011). All average binding was measured by −log10 (peak P-values) in 200-bp bins and are shown by color scale. The following color scales (white, no enrichment; blue, high enrichment) are used for 5hmC, 5mC, and Tet1, respectively: [0, 2], [0, 0.5], and [0, 50]. The presence of CpG islands is displayed in color (blue, present; white, absent). (D) Tet1 occupancy and changes in 5hmC/5mC levels are shown for a group of representative Tet1 targets (Pcdha gene cluster on chr18) in control (Con) and Tet1 knockdown (Tet1 KD) ES cells. Tet1 ChIP-seq data in control knockdown (Con KD) and Tet1 knockdown (Tet1 KD) are shown in read counts, with the Y-axis floor set to 0.2 read per million reads. 5hmC and 5mC levels are shown as log2 ratios of immunoprecipitation/input (IP/input).
Figure 3.
Figure 3.
5hmC is enriched in both repressed (bivalent, Tet1/PRC2-cobound) and actively transcribed (Tet1-only) genes. (A) Heat map representation of genomic regions with enriched 5hmC, binding profile of Tet1 and Ezh2, and major histone modifications (H3K4me3, H3K27me3, and H3K36me3) (Mikkelsen et al. 2007) in mouse ES cells at all Tet1 target genes (5 kb flanking TSSs). The heat map is rank-ordered from genes with the highest H3K27me3 enrichment to no H3K27me3 within 5-kb genomic regions flanking TSSs. The enrichment of 5hmC and 5mC was determined by whole-genome tiling microarrays. The enrichment of Tet1, H3K4me3, H3K27me3, and H3K36me3 binding was determined previously by ChIP-seq analyses (Mikkelsen et al. 2007; Wu et al. 2011). All average binding was measured by −log10 (peak P-values) in 200-bp bins and is shown by color scale. The following color scales (white, no enrichment; blue, high enrichment) are used for 5hmC/5mC, Tet1/H3K27me3/H3K36me3, and H3K4me3, respectively: [0, 2], [0, 50], and [0, 100]. The presence of CpG islands is displayed in color (blue, present; white, absent). (B) Average distribution profiles of 5hmC enrichment are shown for Tet1/PRC2-cobound targets, Tet1-only targets, and nontargets. Averaged expression levels of these three groups of genes are shown in the bottom panels (measured by log2 values of expression microarray signals). (C) Shown are profiles of Tet1 (Wu et al. 2011), 5hmC, Ezh2 (Ku et al. 2008), RNA polymerase II (Seila et al. 2008), and major histone modification (Mikkelsen et al. 2007) occupancy at two representative Tet1 targets: a Tet1/PRC2-cobound target (Lhx2), and a Tet1-only target (Rest promoter). ChIP-seq data in mouse ES cells are shown in read counts, with the Y-axis floor set to 0.2 read per million reads.
Figure 4.
Figure 4.
Relationship between 5hmC enrichment and gene expression in mouse ES cells. (A) Distribution of 5hmC, 5mC, and RNA polymerase II at genes expressed at different levels in ES cells. Enrichment of 5hmC and 5mC was measured by raw log2 ratios of immunoprecipitation/input (IP/input) and MEDME-corrected values of log2 ratios, respectively. (B) Heat map representation of genomic regions with enriched 5hmC, binding profile of Tet1 and Ezh2, and major histone modifications in mouse ES cells at all Tet1 target genes (5 kb flanking TSSs). The heat map is rank-ordered by gene expression levels of Tet1-bound genes. All average binding was measured by −log10 (peak P-values) in 200-bp bins and is shown by color scale. The following color scales (white, no enrichemnt; blue, high enrichment) are used for 5hmC, Tet1/Ezh2/H3K27me3/H3K36me3, and H3K4me3, respectively: [0, 2], [0, 50], and [0, 100].

References

    1. Ball MP, Li JB, Gao Y, Lee JH, LeProust EM, Park IH, Xie B, Daley GQ, Church GM 2009. Targeted and genome-scale strategies reveal gene-body methylation signatures in human cells. Nat Biotechnol 27: 361–368 - PMC - PubMed
    1. Cedar H, Bergman Y 2009. Linking DNA methylation and histone modification: patterns and paradigms. Nat Rev Genet 10: 295–304 - PubMed
    1. Chen X, Xu H, Yuan P, Fang F, Huss M, Vega VB, Wong E, Orlov YL, Zhang W, Jiang J, et al. 2008. Integration of external signaling pathways with the core transcriptional network in embryonic stem cells. Cell 133: 1106–1117 - PubMed
    1. Fouse SD, Shen Y, Pellegrini M, Cole S, Meissner A, Van Neste L, Jaenisch R, Fan G 2008. Promoter CpG methylation contributes to ES cell gene regulation in parallel with Oct4/Nanog, PcG complex, and histone H3 K4/K27 trimethylation. Cell Stem Cell 2: 160–169 - PMC - PubMed
    1. Globisch D, Munzel M, Muller M, Michalakis S, Wagner M, Koch S, Bruckl T, Biel M, Carell T 2010. Tissue distribution of 5-hydroxymethylcytosine and search for active demethylation intermediates. PLoS ONE 5: e15367 doi: 10.1371/journal.pone.0015367 - PMC - PubMed

Publication types

MeSH terms