. 2011 Apr 1;25(7):742-54.
doi: 10.1101/gad.2005511.

Regulating RNA polymerase pausing and transcription elongation in embryonic stem cells

Affiliations

Regulating RNA polymerase pausing and transcription elongation in embryonic stem cells

Irene M Min et al. Genes Dev. .

Abstract

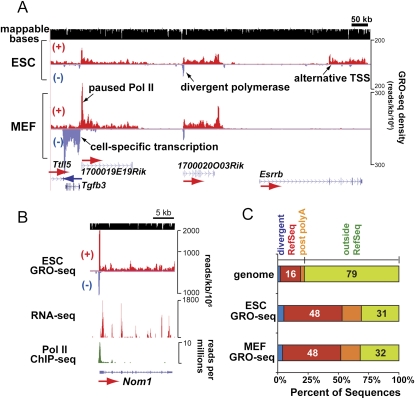
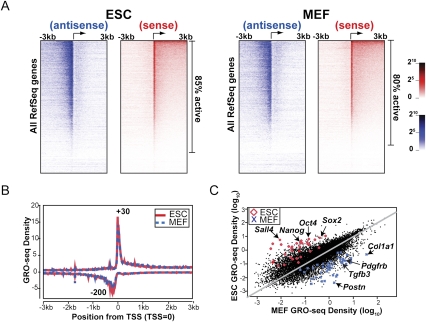
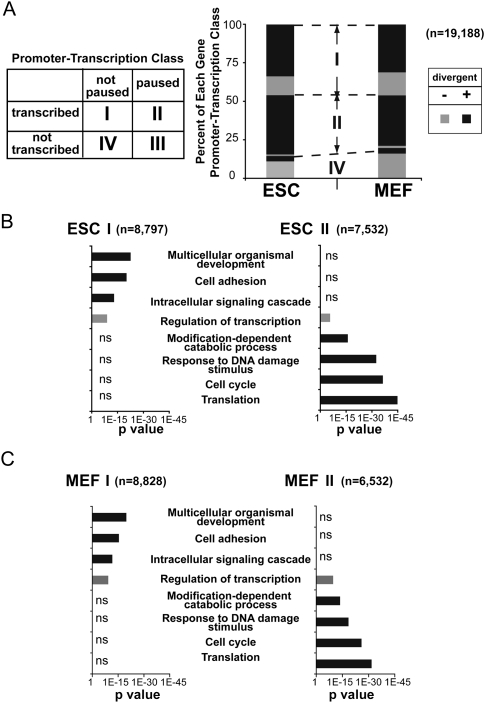
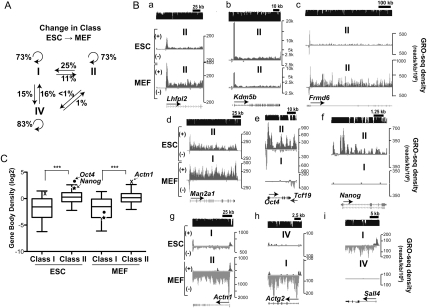
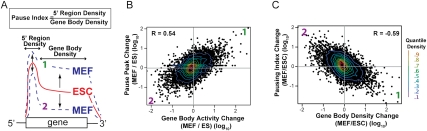
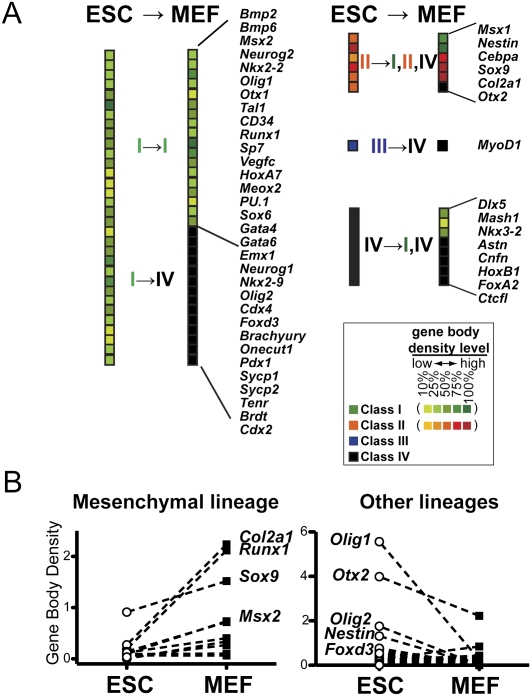
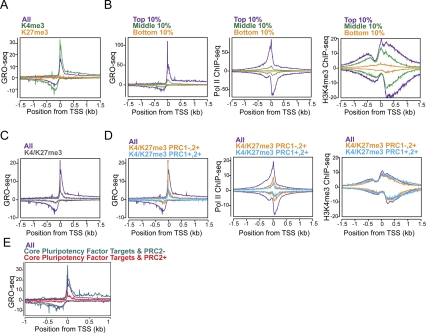
Transitions between pluripotent stem cells and differentiated cells are executed by key transcription regulators. Comparative measurements of RNA polymerase distribution over the genome's primary transcription units in different cell states can identify the genes and steps in the transcription cycle that are regulated during such transitions. To identify the complete transcriptional profiles of RNA polymerases with high sensitivity and resolution, as well as the critical regulated steps upon which regulatory factors act, we used genome-wide nuclear run-on (GRO-seq) to map the density and orientation of transcriptionally engaged RNA polymerases in mouse embryonic stem cells (ESCs) and mouse embryonic fibroblasts (MEFs). In both cell types, progression of a promoter-proximal, paused RNA polymerase II (Pol II) into productive elongation is a rate-limiting step in transcription of ∼40% of mRNA-encoding genes. Importantly, quantitative comparisons between cell types reveal that transcription is controlled frequently at paused Pol II's entry into elongation. Furthermore, "bivalent" ESC genes (exhibiting both active and repressive histone modifications) bound by Polycomb group complexes PRC1 (Polycomb-repressive complex 1) and PRC2 show dramatically reduced levels of paused Pol II at promoters relative to an average gene. In contrast, bivalent promoters bound by only PRC2 allow Pol II pausing, but it is confined to extremely 5' proximal regions. Altogether, these findings identify rate-limiting targets for transcription regulation during cell differentiation.


Figures

Figure 1.
Figure 1.
Densities of nuclear run-on transcripts in ESCs and MEFs analyzed by GRO-seq. (A) GRO-seq map in mouse ESCs and MEFs is presented in a strand-specific manner, with run-on transcripts along the top/forward (red +) and bottom/reverse (blue −) strands. GRO-seq reads are aligned to the genome at 1-nt resolution and the positions of their 5′ ends are displayed. GRO-seq densities are plotted here and hereafter as the number of reads per 1 kb per 1 million total uniquely mapped sequences in each library. Mappable regions are depicted as black bars in the top row, and RefSeq gene annotations are shown in the bottom row. (B) The mouse ESC GRO-seq map of the Nom1 gene is compared with maps of other genome-wide assays in ESCs. Y-axes show the total sequence reads per 1 kb per 1 million total uniquely mapped sequences (GRO-seq and RNA-seq) (Cloonan et al. 2008) or per million reads (Pol II ChIP-seq) (Seila et al. 2008). (C) The distributions of all mapped GRO-seq reads inside or outside (green) of RefSeq gene annotation are given for ESCs and MEFs. Annotated transcription units (red) are extended by 10 kb downstream on the same strand to include post-polyA transcription (orange), and by 5 kb upstream on the opposite strand to include the peak of divergent polymerase (blue). The percentages of the genome and GRO-seq libraries with respect to each relevant annotation are given in the bar graph (with divergent peaks accounting for 2%, 5%, and 4% of the genome, ESC, and MEF libraries, respectively, and post-polyA transcription accounting for 3%, 16%, and 16% as well).
Figure 2.
Figure 2.
Comparisons of GRO-seq densities in the promoter-proximal region and gene body in ESCs and MEFs. (A) Heat map display of ESC and MEF GRO-seq densities for all RefSeq genes. For each cell type, gene order is listed from the highest (top) to the lowest (bottom) GRO-seq density in the gene body in the sense direction. Each row represents the average value of a block of 40 genes. (B) Average GRO-seq densities are plotted for all mappable RefSeq genes in 5-bp bins scanning 3 kb upstream of and downstream from the TSS for both ESCs and MEFs. (C) GRO-seq densities (number of reads on coding strand from +1 kb to the polyA annotation divided by mappable fraction of that length in kilobases and normalized by library size in millions) of all mappable RefSeq genes are compared between ESCs and MEFs. Fifty of the most highly enriched mature mRNAs in ESCs versus MEFs identified by previous microarray analysis (Sridharan et al. 2009) are highlighted on the plots. (Red diamond) ESCs; (blue cross) MEFs. A few genes with known function or expression pattern in each cell type are indicated with arrows.
Figure 3.
Figure 3.
Rate-limiting steps in transcription of individual genes and GO analysis of genes with paused Pol II peak. (A, left) Based on the GRO-seq profiles, each gene in each cell type was classified as transcribed if the density in the gene body was significantly above background, and as paused if the promoter-proximal density was significantly above the level in the gene body (Core et al. 2008). (Right) The fractions of each gene activation class were determined for ESCs and MEFs. The total number of RefSeq genes is 19,188. Additionally, each gene was classified as to whether it had a significant level of divergent polymerase or not. In each class, the fractions of genes with divergent polymerase activity are indicated with a darker shade. The small class III contains only 45 genes in ESCs and 37 genes in MEFs and is not displayed. (B,C) GO analysis of class I (paused, transcribed) and class II (not paused, transcribed) genes in ESCs (B) and MEFs (C) shows GO terms that show significant enrichment relative to all RefSeq genes in black (if significant in only one class) or gray (if significant in both classes). The numbers of genes in each class are given in parentheses.
Figure 4.
Figure 4.
Targets of regulation in the transition from ESCs to MEFs. (A) The percentages of genes from each promoter transcription class that change class from ESCs to MEFs are presented above each straight arrow. The circular arrows represent the number of genes that do not change classification. (B) Representative GRO-seq plots comparing ESCs (top) versus MEFs (bottom) of genes that maintain (panels a–c) or switch (panels d–i) their promoter transcription class. (C) Comparisons of the average GRO-seq densities in the bodies of class I and class II genes in ESCs and MEFs. Oct4 (dot) and Nanog (star), two core pluripotency factors that switched from class II in ESCs to class I in MEFs, are presented to show the difference in the gene body densities between two cell types. Actn1, which is significantly up-regulated in MEFs and switched from class I in ESCs to class II in MEFs, is indicated with an X. The middle line in each box plot indicates the median value, the top and bottom edges of the box plot are the 75th and 25th percentiles, and the small horizontal bars denote the 95th and fifth percentiles. (***) P-value < 0.0001 by Mann-Whitney test.
Figure 5.
Figure 5.
Regulation of gene expression by changing the efficiency of entry into productive elongation. (A) Illustrations depicting types of transcriptional activity change in MEFs (increase [1] and decrease [2]) relative to ESCs representing quadrants 1 and 2, as in B and C, are provided. Pause index is defined as the ratio of pause peak density to gene body density. The fold changes of pause peak GRO-seq density (B) or pausing index (C) versus gene body GRO-seq density in MEFs relative to ESCs are plotted for all mappable genes. The R-value, determined by Pearson's correlation, is presented within the plot. Contour lines by decile are shown in the heat map scale at the right.
Figure 6.
Figure 6.
Developmental regulators of many lineages are transcribed but not paused in ESCs. (A) The promoter transcription classes and GRO-seq levels of known regulators associated with lineage specification are shown for ESCs and MEFs. The GRO-seq density levels in the body of the gene (from the lowest to the highest, 10%, 25%, 50%, 75%, and 100%, as ranked by the gene body density) is indicated by heat map for class I (green) and class II (orange) genes. The lists of developmental regulators are compiled from Mikkelsen et al. (2007), Stock et al. (2007), and Marson et al. (2008). (B) The changes in the GRO-seq gene body density for developmental controllers and markers involved in mesenchymal lineages (left) or all lineages except for mesenchymal lineages (right) are compared between ESCs and MEFs. Significance of changes in expression levels between cell types are P < 0.05 for mesenchymal and P < 0.01 for nonmesenchymal lineage controllers by Mann-Whitney test.
Figure 7.
Figure 7.
Regulation of distinct steps in transcription at polycomb target genes. (A) GRO-seq metagene profiles of all genes (purple), the subset of genes marked with H3K4me3 but not H3K27me3 (green), or the subset with H3K27me3 but not H3K4me3 (orange) near the promoters in ESCs (Ku et al. 2008). (B) The composite profiles of GRO-seq, Pol II (8WG16) ChIP-seq (Seila et al. 2008), and H3K4me3 ChIP-seq (Mikkelsen et al. 2007) are shown for genes whose level of expression in the gene bodies are in the top 10% (purple), middle 10% (green), and bottom 10% (orange) of active genes in ESCs, as determined by GRO-seq. The Y-axis is reads per kilobase per million. For ChIP-seq data, the forward and reverse reads are plotted above and below the horizontal axis, respectively. The midpoint between peaks of forward and reverse read density corresponds to the in vivo binding site, as described in Seila et al. (2008). (C) GRO-seq metagene profiles for all genes (purple) and H3K4me3/H3K27me3 bivalent genes (gray) (Ku et al. 2008). (D) Bivalent genes were subclassified into those that have PRC1 (cyan) or not (squash), based on Ku et al. (2008). The composite profiles for each subclass are plotted for GRO-seq, Pol II ChIP-seq, and H3K4me3 ChIP-seq, as in B. (E) The average GRO-seq densities of genes targeted by core pluripotency transcription factors with (sea green; n = 381) or without (red; n = 2,838) PRC2 component SUZ12 co-occupancy in ESCs. The gene lists were taken from Marson et al. (2008).

References

    1. Adelman K, Marr MT, Werner J, Saunders A, Ni Z, Andrulis ED, Lis JT 2005. Efficient release from promoter-proximal stall sites requires transcript cleavage factor TFIIS. Mol Cell 17: 103–112 - PubMed
    1. Affymetrix/Cold Spring Harbor Laboratory ENCODE Transcriptome Project 2009. Post-transcriptional processing generates a diversity of 5′-modified long and short RNAs. Nature 457: 1028–1032 - PMC - PubMed
    1. Barrera LO, Li Z, Smith AD, Arden KC, Cavenee WK, Zhang MQ, Green RD, Ren B 2008. Genome-wide mapping and analysis of active promoters in mouse embryonic stem cells and adult organs. Genome Res 18: 46–59 - PMC - PubMed
    1. Boehm AK, Saunders A, Werner J, Lis JT 2003. Transcription factor and polymerase recruitment, modification, and movement on dhsp70 in vivo in the minutes following heat shock Mol Cell Biol 23: 7628–7637 - PMC - PubMed
    1. Boettiger AN, Levine M 2009. Synchronous and stochastic patterns of gene activation in the Drosophila embryo. Science 325: 471–473 - PMC - PubMed

Publication types