. 2011 Jun;21(6):830-9.
doi: 10.1101/gr.115907.110. Epub 2011 Apr 1.

Natural genetic variation caused by small insertions and deletions in the human genome

Affiliations

Natural genetic variation caused by small insertions and deletions in the human genome

Ryan E Mills et al. Genome Res. 2011 Jun.

Abstract

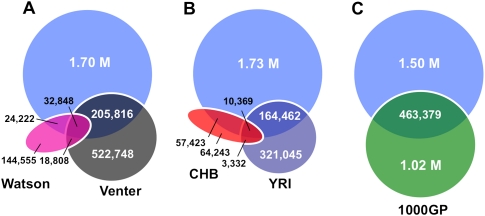
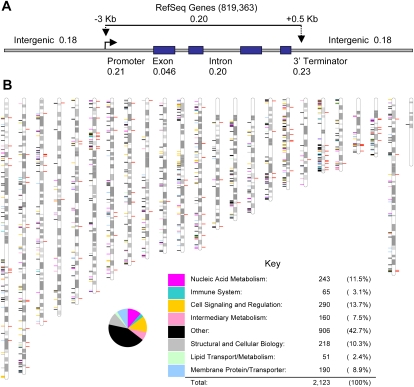
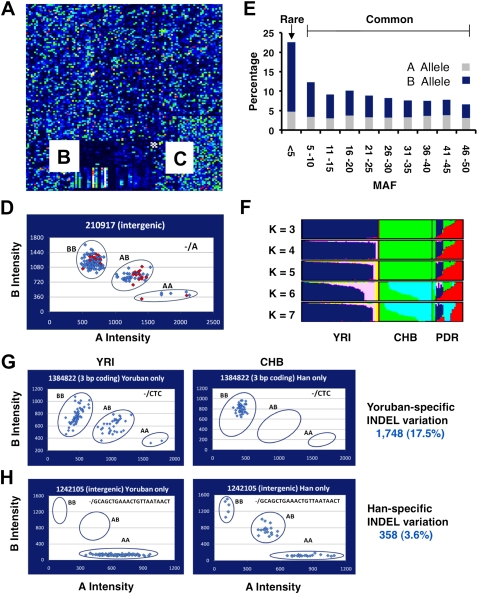
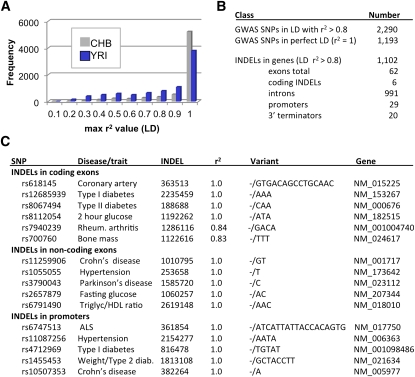
Human genetic variation is expected to play a central role in personalized medicine. Yet only a fraction of the natural genetic variation that is harbored by humans has been discovered to date. Here we report almost 2 million small insertions and deletions (INDELs) that range from 1 bp to 10,000 bp in length in the genomes of 79 diverse humans. These variants include 819,363 small INDELs that map to human genes. Small INDELs frequently were found in the coding exons of these genes, and several lines of evidence indicate that such variation is a major determinant of human biological diversity. Microarray-based genotyping experiments revealed several interesting observations regarding the population genetics of small INDEL variation. For example, we found that many of our INDELs had high levels of linkage disequilibrium (LD) with both HapMap SNPs and with high-scoring SNPs from genome-wide association studies. Overall, our study indicates that small INDEL variation is likely to be a key factor underlying inherited traits and diseases in humans.


Figures

Figure 1.
Figure 1.
Comparisons of our data with small INDELs identified from other projects. (A,B) Diagrams comparing the 1.96 million INDELs discovered in this study with the small INDELs that were identified in four personal genomes. (A) Comparison of our 1.96 million INDELs (light blue, top) with Venter (Levy et al. 2007) and Watson (Wheeler et al. 2008) INDELs. (B) Comparison of our 1.96 million INDELs (light blue, top) with Han Chinese (Wang et al. 2008) and Yoruban (Bentley et al. 2008) INDELs, (C) Comparison of our 1.96 million INDELs (light blue, top) with the 1.48 million INDELs identified by the 1000 Genomes Project (1000GP) (The 1000 Genomes Project Consortium 2010).
Figure 2.
Figure 2.
Distribution of coding exon variants in the human genome. (A) The figure depicts a typical RefSeq gene and its features. 819,363 small INDELs from our study were mapped to RefSeq genes. The INDEL-to-SNP ratios for each genomic compartment are indicated. (B) The 1205 genes that were affected by 2123 coding exon variants (Supplemental Table 5) are indicated on the map of human chromosomes (colored marks to the left of the chromosomes indicate an affected gene). Each mark is indexed by color to indicate gene function (and is cross-referenced to the pie chart below). A red mark to the right of each chromosome indicates that the affected gene previously was linked to a known disease. The pie chart shows the functional breakdown of the coding variants.
Figure 3.
Figure 3.
Affymetrix INDEL genotyping arrays. (A–C) A region of a custom Affymetrix INDEL microarray is shown following hybridization and scanning using protocols established for the Affymetrix 6.0 array. Section C contains 1500 Affymetrix SNPs that were developed for the HapMap project and are also present on the SNP 6.0 array. These were included as positive controls. The average cqc for our arrays after excluding arrays with scores below 0.4 was 2.2, with a range of 0.53–3.67. The call rate was 96.1%. Section B contains a manufacturing control. Section A represents the remainder of the array, which contains INDEL probes. (D) Plot of signal intensities for a typical set of INDEL probes following BRLLM-P analysis. Note that three distinct clusters were obtained for the three INDEL states (AA, AB, BB). PCR validation studies were conducted in parallel to evaluate the accuracy of the calls (Supplemental Table 9). A typical result is shown for INDEL 210917. The 24 individuals from the polymorphism discovery resource (PDR) (Collins et al. 1999) that were sampled by PCR are shown in red (the calls were 100% concordant between the arrays and the PCRs). The overall validation rate with 12 representative INDEL assays in 24 individuals was 99% (Supplemental Table 9). (E) Allelic frequencies. The allelic frequencies are plotted for the 10,003 INDELs that were examined on the INDEL microarrays (Supplemental Table 8). Although the majority of variation meets the definition of common genetic variation (where the minor allele has a frequency of ≥5%), rare INDELs also were identified. (F) Structure plot of INDEL data. The INDEL genotypes from our arrays were analyzed for population substructure. The PDR panel, which was designed to capture global diversity, has a large degree of substructure (as indicated by the colored peaks; right). The Yoruban (YRI) and CHB populations also have some residual substructure. (G) Population-specific INDEL variation. INDELs were identified where both INDEL alleles were present in one population but only one allele was present in the other. An example of a YRI-specific INDEL is shown. Note that both A and B alleles are present in the YRI population (and all three genotypes are present), whereas only the B allele (and one genotype) is present in the CHB population. The INDEL shown (1384822) is a 3-bp coding INDEL. (H) An example of a CHB-specific INDEL.
Figure 4.
Figure 4.
Linkage disequilibrium between SNPs and INDELs. (A) The r2 value was calculated for each SNP within a 1-Mb window of a given INDEL using the SNP genotypes that have been reported for HapMap 3 (http://hapmap.ncbi.nlm.nih.gov/) and our INDEL genotyping data from the same samples. For each population (YRI, CHB), the SNP with the maximum r2 value was identified (Supplemental Table 13). INDELs in perfect LD with a SNP have an r2 of 1.0. (B) LD also was examined for high-scoring SNPs (with P-values <0.001) that were identified in 118 GWAS studies (Supplemental Table 14; Johnson and O'Donnell 2009). GWAS SNPs that have high levels of LD (r2 > 0.8) with INDELs are summarized. (C) Examples of INDELs from B that map to functional regions of genes. The 16 examples were taken from a larger collection of 1102 INDELs that have high levels of LD with GWAS SNPs and also map to genes (Supplemental Table 15).

Similar articles

Cited by

References

    1. The 1000 Genomes Project Consortium 2010. A map of human genome variation from population-scale sequencing. Nature 467: 1061–1073 - PMC - PubMed
    1. Ahn SM, Kim TH, Lee S, Kim D, Ghang H, Kim DS, Kim BC, Kim SY, Kim WY, Kim C, et al. 2009. The first Korean genome sequence and analysis: Full genome sequencing for a socio-ethnic group. Genome Res 19: 1622–1629 - PMC - PubMed
    1. Balaci L, Spada MC, Olla N, Sole G, Loddo L, Anedda F, Naitza S, Zuncheddu MA, Maschio A, Altea D, et al. 2007. IRAK-M is involved in the pathogenesis of early-onset persistent asthma. Am J Hum Genet 80: 1103–1114 - PMC - PubMed
    1. Bennett EA, Coleman LE, Tsui C, Pittard WS, Devine SE 2004. Natural genetic variation caused by transposable elements in humans. Genetics 168: 933–951 - PMC - PubMed
    1. Bentley DR, Balasubramanian S, Swerdlow HP, Smith GP, Milton J, Brown CG, Hall KP, Evers DJ, Barnes CL, Bignell HR, et al. 2008. Accurate whole human genome sequencing using reversible terminator chemistry. Nature 456: 53–59 - PMC - PubMed

Publication types

Associated data