. 2011 Jun 1;22(11):1907-18.
doi: 10.1091/mbc.E11-02-0101. Epub 2011 Apr 1.

A new role for the dynamin GTPase in the regulation of fusion pore expansion

Affiliations

A new role for the dynamin GTPase in the regulation of fusion pore expansion

Arun Anantharam et al. Mol Biol Cell. .

Abstract

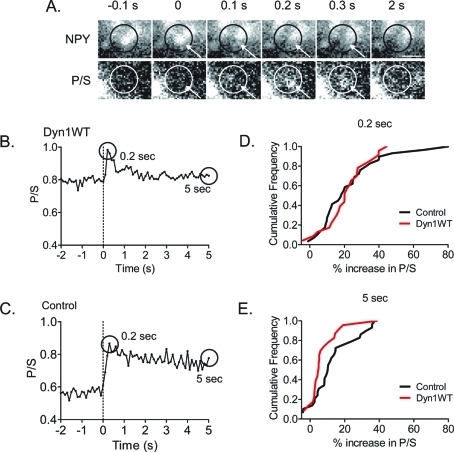
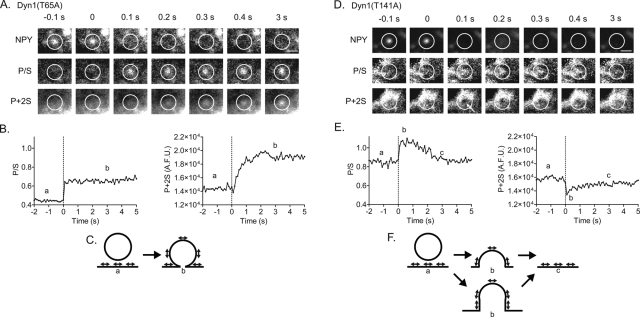
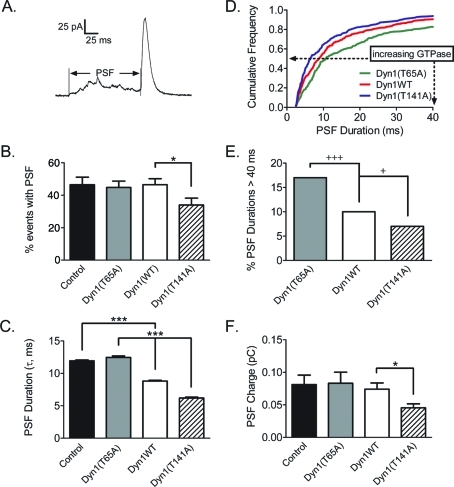
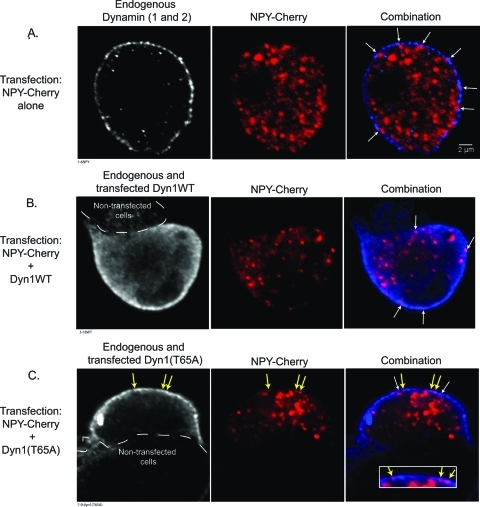
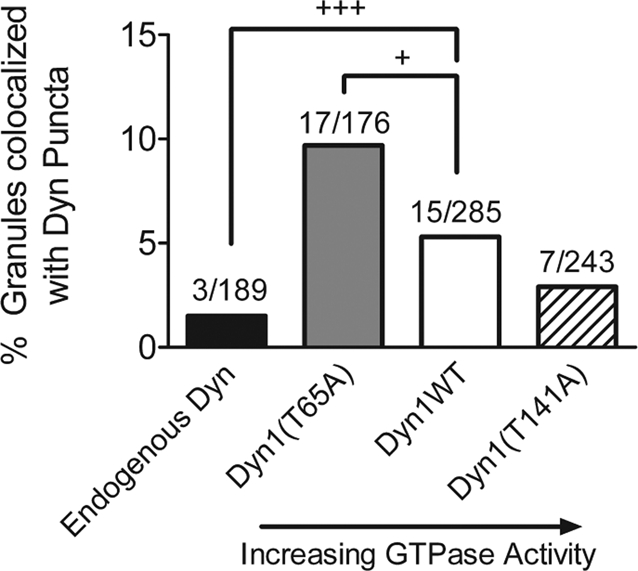
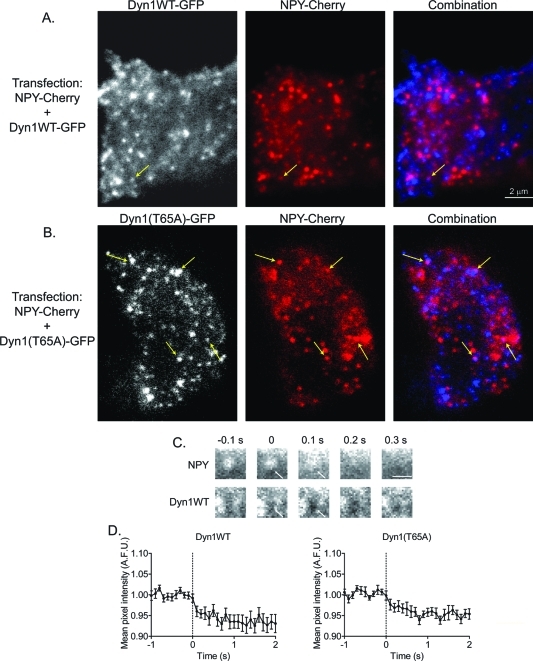
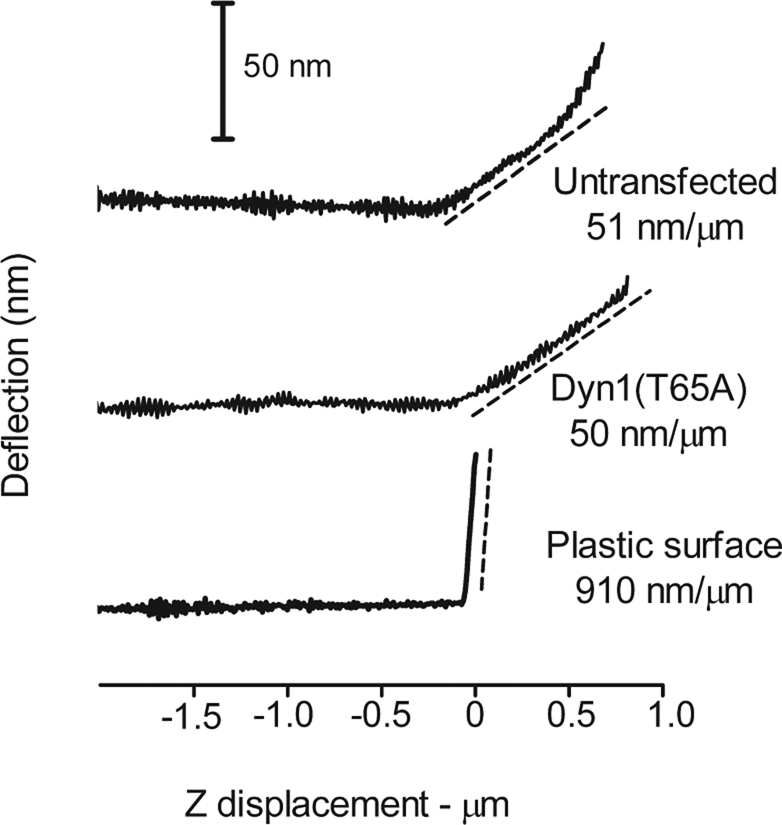
Dynamin is a master regulator of membrane fission in endocytosis. However, a function for dynamin immediately upon fusion has also been suspected from a variety of experiments that measured release of granule contents. The role of dynamin guanosine triphosphate hydrolase (GTPase) activity in controlling fusion pore expansion and postfusion granule membrane topology was investigated using polarization optics and total internal reflection fluorescence microscopy (pTIRFM) and amperometry. A dynamin-1 (Dyn1) mutant with increased GTPase activity resulted in transient deformations consistent with rapid fusion pore widening after exocytosis; a Dyn1 mutant with decreased activity slowed fusion pore widening by stabilizing postfusion granule membrane deformations. The experiments indicate that, in addition to its role in endocytosis, GTPase activity of dynamin regulates the rapidity of fusion pore expansion from tens of milliseconds to seconds after fusion. These findings expand the membrane-sculpting repertoire of dynamin to include the regulation of immediate postfusion events in exocytosis that control the rate of release of soluble granule contents.


Figures

FIGURE 1:
FIGURE 1:
Membrane deformations at the sites of granule fusion are more transient in cells with transfected Dyn1WT than without (control). (A) Images are shown of pTIRFM responses (P/S) to exocytosis in a cell with transfected human Dyn1WT. Circles and arrows highlight the region of the transient P/S increase. Scale bar: 1 μm. (B) The P/S intensity from A is depicted in the graph. The dotted line indicates the frame before fusion of the NPY-Cer–labeled granule. (C) An example of the P/S response in a control (no transfected dynamin) cell is shown. (D) Cumulative frequency histograms were generated to compare the dynamics of the P/S change observed at 0.2 and 5 s (P/S at these times is circled in graphs shown in B and C) in cells without and with transfected Dyn1WT. Percent increases for individual events were calculated by taking the difference between the P/S at indicated times after granule fusion (P/S)f and the average P/S of 20 pre-fusion frames (Avepre), divided by the average; [(P/S)f − Avepre]/Avepre. At 0.2 s, the same proportion of fusion events (87%) were associated with a significant increase in P/S. By 5 s, the P/S change had declined to baseline in a greater proportion of events from cells transfected with Dyn1WT than control. Dyn1WT, n = 23 events from 5 cells. Control, n = 29 events from 8 cells. The two groups are significantly different at 5 s (p < 0.05, Mann–Whitney test).
FIGURE 2:
FIGURE 2:
Examples of membrane topological changes after fusion in cells expressing Dyn1 GTPase mutants. Chromaffin cells were cotransfected with NPY-Cer and either Dyn1(T65A) or Dyn1(T141A). (A) Images are shown of pTIRFM responses (P/S and P + 2S) to exocytosis in a cell with transfected human Dyn1(T65A). (B) The P/S and P + 2S increase is long-lived in a cell transfected with Dyn1(T65A) with low GTPase activity. (C) One interpretation of the event is considered in the cartoon. The data are also consistent with a diI-labeled granule having undergone endocytosis at the site of fusion and remaining close to the plasma membrane (not shown). diI transition dipole moment orientation is indicated by direction of arrowheads. (D, E) Conversely, the P/S increase after fusion is transient in a cell transfected with Dyn1(T141A) with elevated GTPase activity. P + 2S transiently decreases in region highlighted by white arrow (D). (F) The changes observed are consistent with computer simulations of structures shown in the cartoon. Another possibility not shown is rapid endocytosis with retreat of the diI-labeled granule into the cell.
FIGURE 3:
FIGURE 3:
Dyn1 GTPase activity regulates the dynamics of membrane deformations after fusion. (A) Cumulative frequency histograms were generated to compare the dynamics of the P/S change observed at 0.2, 0.5, and 2 s in cells transfected with Dyn1(T65A), Dyn1(T141A), and Dyn1WT. For Dyn1WT and Dyn1(T141A), the distribution of P/S changes at 0.5 and 2 s are significantly different (p < 0.01, Wilcoxon matched-pairs test) from the distribution at 0.2 s. The distribution of P/S changes at 0.5 and 2 s is not significantly different from the distribution at 0.2 s for Dyn1(T65A). (B) The P/S increase remaining after 0.2 and 2 s postfusion is shown in the cumulative histogram. At 0.2 s, Dyn1(T141A) is significantly different from Dyn1WT (p < 0.05, Mann–Whitney test); Dyn1(T65A) is not significantly different from Dyn1WT. At 2 s, Dyn1(T141A) is not significantly different from Dyn1WT; Dyn1(T65A) is significantly different from Dyn1WT (p < 0.01, Mann–Whitney test). Dyn1(T65A), n = 23 events from 7 cells; Dyn1(T141A), n = 29 events from 6 cells. (C) The duration of P + 2S changes. Each data point represents an individual event. The number of decreases or increases in P + 2S was tabulated for each group as indicated in the cumulative histogram (e.g., P + 2S decreased after 11 out of 29 total fusion events for Dyn1(T141A), and 3 out of 23 total fusion events for Dyn1WT).
FIGURE 4:
FIGURE 4:
Amperometry of individual catecholamine release events indicates that Dyn1 GTPase activity regulates early fusion pore expansion. (A) An example of an amperometric spike with a long PSF. (B) The average frequency of spike events preceded by a PSF in a cell. Spikes: control, n = 601/37 cells; Dyn1WT, n = 594/43 cells; Dyn1(T141A), n = 720/45cells; Dyn1(T65A), n = 588/33 cells. Control is not significantly different from Dyn1WT. Dyn1(T65A) is not significantly different from Dyn1WT (*p < 0.05, Student's t test). Dyn1(T141A) is significantly different from Dyn1WT. (C) PSF durations (τ) were calculated as described in Materials and Methods (***p < 0.001, Student's t test). (D) Relative cumulative histogram of PSF durations for Dyn1WT and mutants. (E) The fraction of PSFs with durations greater than 40 ms (+p < 0.05,+++p < 0.001, test of binomial probability). (F) Median charge released during PSF (*p < 0.05, Student's t test). No significant differences found between control and Dyn1WT or between Dyn1(T65A) and Dyn1WT.
FIGURE 5:
FIGURE 5:
Confocal imaging of chromaffin cells shows Dyn1 expression to be punctate and primarily localized to the plasma membrane. Chromaffin cells cultured on glass coverslips were transfected with a plasmid encoding NPY-Cherry alone (A), with a plasmid encoding Dyn1WT (B), or with a plasmid encoding Dyn1(T65A) (C). Four or five days after transfection, cells were fixed, permeabilized, and exposed to the Hudy 1 antibody, which recognizes an epitope within the PRD of dynamin. Confocal sections were taken through the center of the cells of interest. Dyn1 is colored blue in the combination. White arrows indicate examples of secretory granules that are in close apposition but not coinciding with dynamin puncta (center of intensities separated by greater than 70 nm). Yellow arrows in (C) indicate granules that overlap with dynamin puncta (center of intensities within 70 nm). Inset in combination in (C) shows higher magnification of area above, with white arrows omitted. Areas of the cell membrane abutting other cells did not stain as well for Dyn1 as those exposed to the extracellular medium (B, C, dashed line indicating outline of neighboring nontransfected cell).
FIGURE 6:
FIGURE 6:
Colocalization of granules with Dyn1 puncta. The percentage of granules showing overlapping expression with Dyn1 puncta (center of intensities within 70 nm, as shown in yellow arrows in Figure 5) is indicated for endogenous (Dyn1 and Dyn2) and transfected Dyn1. Numbers above columns indicate number of overlapping granules and dynamin puncta/total number of granules analyzed (8–12 cells/group; +p < 0.05,+++p < 0.001, test of binomial probability).
FIGURE 7:
FIGURE 7:
Simultaneous imaging of Dyn1-GFP and NPY-Cherry with TIRFM. (A) Chromaffin cells were cotransfected with Dyn1WT-GFP (left panel) and NPY-Cherry (middle panel); the combination image is shown in the right panel. The yellow arrow indicates an area of dynamin and granule overlap. (B) Chromaffin cells were cotransfected with Dyn1(T65A)-GFP (left) and NPY-Cherry (middle); the combination image is shown in the right panel. Yellow arrows indicate areas of dynamin and granule overlap. (C) A cell transfected with NPY-Cherry and Dyn1WT-GFP was depolarized with high extracellular K+. A decrease in Dyn1-GFP intensity upon fusion is observed in region highlighted with arrow. (D) Dyn1WT-GFP (left) and Dyn1(T65A)-GFP (right) intensity were measured in regions of the field corresponding to granule fusion sites (ROI 292-nm radius). Dyn1WT-GFP (n = 31, 5 cells) and Dyn1(T65A)-GFP (n = 23, 7 cells) intensity values from individual fusion events were normalized to the average of 20 prefusion frames. Normalized intensities were then aligned to the prefusion frame (dotted line) and averaged (data presented as mean ± SEM).
FIGURE 8:
FIGURE 8:
Atomic force measurements of surface elasticity of untransfected cells and cells transfected with Dyn1(T65A). Representative probe deflections during approach to (A) a nontransfected cell, (B) a cell transfected with Dyn1(T65A), and (C) the bottom of a plastic petri dish. NPY-Cherry was cotransfected with Dyn1(T65A) to detect the cell in B. Shown are the probe deflections vs. probe approach (Z) to the cell surface. The initial slopes are indicated in terms of nanometer probe deflection vs. probe approach. The spring constant of the probe was ∼ 0.01 nN/m.

References

    1. Albillos A, Dernick G, Horstmann H, Almers W, Alvarez de Toledo G, Lindau M. The exocytotic event in chromaffin cells revealed by patch amperometry. Nature. 1997;389:509–512. - PubMed
    1. Anantharam A, Axelrod D, Holz RW. Polarized TIRFM reveals changes in plasma membrane topology before and during granule fusion. Cell Mol Neurobiol. 2010a;30:1343–1349. - PMC - PubMed
    1. Anantharam A, Onoa B, Edwards RH, Holz RW, Axelrod D. Localized topological changes of the plasma membrane upon exocytosis visualized by polarized TIRFM. J Cell Biol. 2010b;188:415–428. - PMC - PubMed
    1. Artalejo CR, Elhamdani A, Palfrey HC. Sustained stimulation shifts the mechanism of endocytosis from dynamin-1-dependent rapid endocytosis to clathrin- and dynamin-2-mediated slow endocytosis in chromaffin cells. Proc Natl Acad Sci USA. 2002;99:6358–6363. - PMC - PubMed
    1. Artalejo CR, Henley JR, McNivan MA, Palfrey HC. Rapid endocytosis coupled to exocytosis in adrenal chromaffin cells involves Ca2+, GTP, and dynamin but not clathrin. Proc Natl Acad Sci USA. 1995;92:8328–8332. - PMC - PubMed

Publication types

MeSH terms

LinkOut - more resources