. 2011 May 15;22(10):1791-805.
doi: 10.1091/mbc.E10-10-0854. Epub 2011 Apr 1.

Whole genome siRNA cell-based screen links mitochondria to Akt signaling network through uncoupling of electron transport chain

Affiliations

Whole genome siRNA cell-based screen links mitochondria to Akt signaling network through uncoupling of electron transport chain

William T Senapedis et al. Mol Biol Cell. .

Abstract

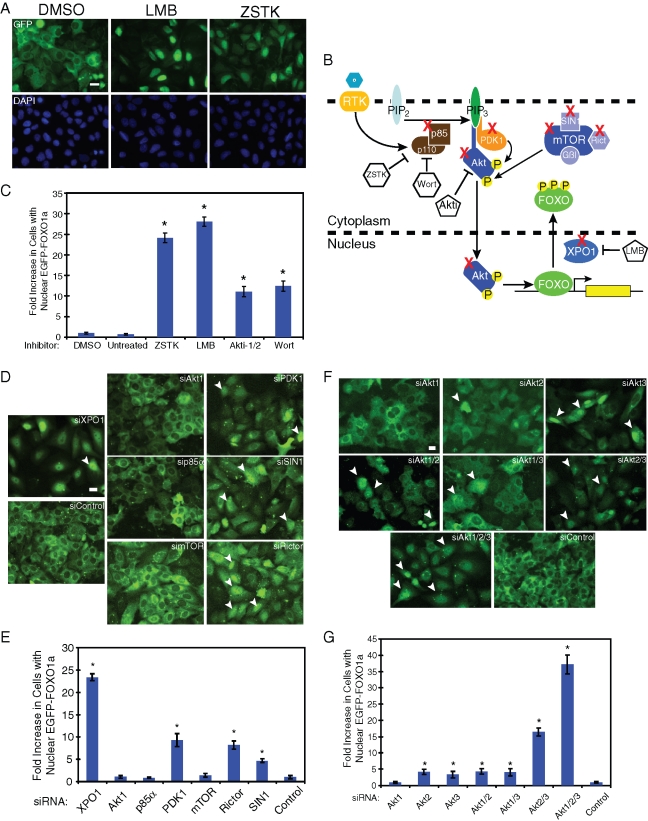
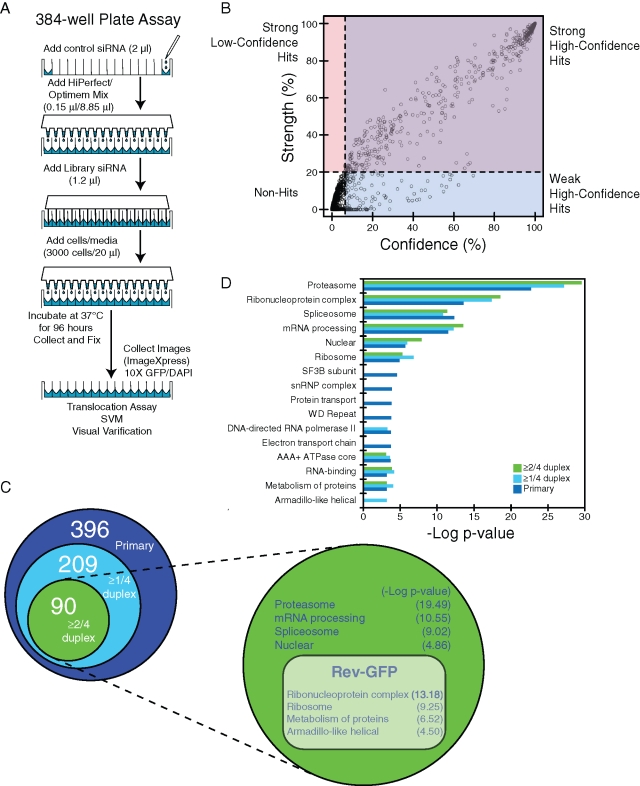
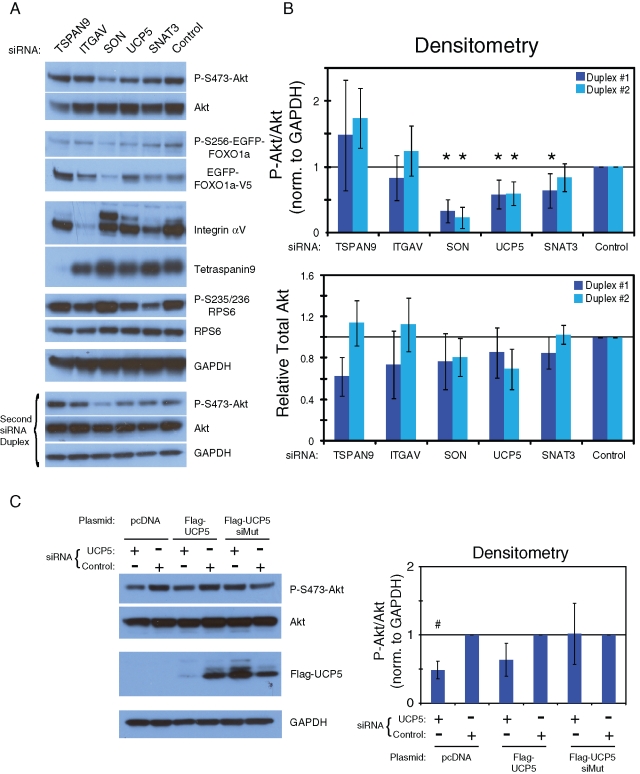
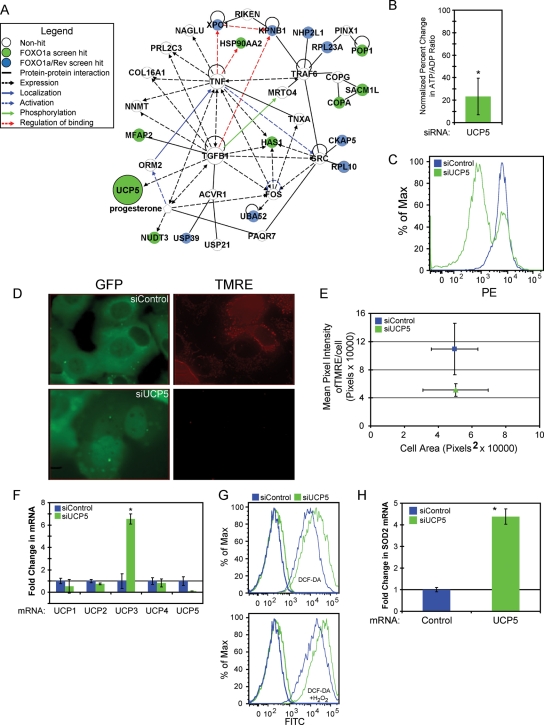
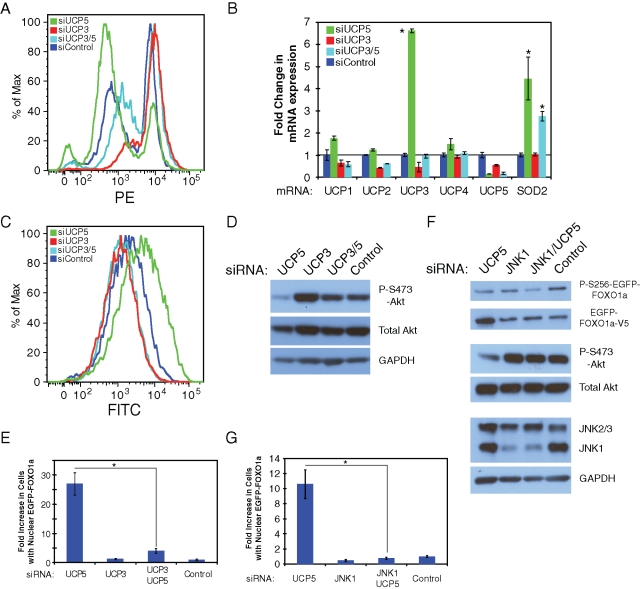
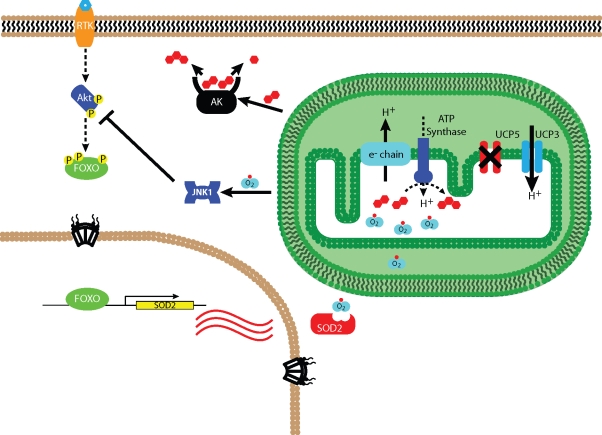
Forkhead transcription factors (FOXOs) alter a diverse array of cellular processes including the cell cycle, oxidative stress resistance, and aging. Insulin/Akt activation directs phosphorylation and cytoplasmic sequestration of FOXO away from its target genes and serves as an endpoint of a complex signaling network. Using a human genome small interfering RNA (siRNA) library in a cell-based assay, we identified an extensive network of proteins involved in nuclear export, focal adhesion, and mitochondrial respiration not previously implicated in FOXO localization. Furthermore, a detailed examination of mitochondrial factors revealed that loss of uncoupling protein 5 (UCP5) modifies the energy balance and increases free radicals through up-regulation of uncoupling protein 3 (UCP3). The increased superoxide content induces c-Jun N-terminal kinase 1 (JNK1) kinase activity, which in turn affects FOXO localization through a compensatory dephosphorylation of Akt. The resulting nuclear FOXO increases expression of target genes, including mitochondrial superoxide dismutase. By connecting free radical defense and mitochondrial uncoupling to Akt/FOXO signaling, these results have implications in obesity and type 2 diabetes development and the potential for therapeutic intervention.


Figures

FIGURE 1:
FIGURE 1:
Knockdown of the Akt signaling pathway using small molecules and RNAi localizes FOXO1a to the nucleus in U2OS cells. (A) Microscope images of U2OS EGFP-FOXO1a cells taken after treatment with labeled small molecule for 24 h. GFP images represent EGFP-FOXO1a expression and DAPI represents nuclear DNA. Scale bar: 20 μm. (B) Simplified model showing specific proteins in Akt signaling pathway that were inhibited by small molecules or targeted for siRNA knockdown (X). p85α is a regulatory subunit of PI3K, which converts phosphatidylinositol 4,5-bisphosphate (PIP2) to phosphatidylinositol 3,4,5-trisphosphate (PIP3). PIP3 recruits Akt and phosphoinositide-dependent protein kinase (PDK1) to the plasma membrane, where PDK1 and mTORC2 (mTOR/SIN1/Rictor/Gβl) activate Akt. Akt localizes to the nucleus and phosphorylates FOXO, leading to its nuclear export by exportin-1 (XPO1). Wortmannin (Wort) and ZSTK474 (ZSTK) block the activation of PI3K, deactivating Akt. Akti-1/2 (Akti) blocks Akt activation directly. LMB alkylates and directly inhibits XPO1. (C) Automated counting of cells using nuclear translocation analysis (see Materials and Methods). About 1000 cells were counted for each well, with eight wells (of 96 wells) counted for each treatment. GFP nuclei/total number of cells (%) was used to calculate fold increase of cells with GFP nuclei when compared to DMSO treatment. Student's t test was used to compare test to control siRNAs (*p < 0.05). (D) Microscope images of U2OS EGFP-FOXO1a after siRNA knockdown. Arrows are representative cells with nuclear EGFP-FOXO1a. Scale bar: 20 μm. (E) The nuclear translocation analysis was used on four wells of each siRNA pool in a 96-well plate to determine fold increase in cells with nuclear EGFP-FOXO1a when compared to nontargeting siRNA cells (siControl). (F) Microscope images of EGFP-FOXO1a after siRNA knockdown. Arrows represent nuclear EGFP-FOXO1a cells. Scale bar: 20 μm. (F) Nuclear translocation analysis used in six wells of each siRNA pool in a 96-well plate to determine fold increase in cells with nuclear EGFP-FOXO1a when compared to nontargeting siRNA cells (siControl). Student's t test was used to compare test to control siRNAs (*p < 0.05) (see also Figures S1–S3).
FIGURE 2:
FIGURE 2:
High-throughput screening determines regulators of FOXO1 nuclear localization. (A) Schematic of the 384-well plate format screened in U2OS EGFP-FOXO1a and Rev-GFP cells. (B) False discovery thresholds for each model (horizontal and vertical dashed lines) were used to identify strong hits (purple) and weak hits (blue), as well as potential hits that would have been misclassified due to confidence model overfitting (pink). (C) A Venn diagram of hits from primary (dark blue) and validation screens (≥ 1/4 duplexes, light blue; ≥ 2/4 duplexes, green). Projection is functional analysis of two or more out of four duplexes from the validation screen tested in Rev-GFP cells. The DAVID database (http://david.abcc.ncifcrf.gov/) was used to group related categories and eliminate redundancy. This group's categories are specific to EGFP-FOXO1a nuclear localization (dark green) and those present in both screens (light green). Negative log p-values are present in parentheses. (D) Functional analysis using the primary and validation list from Tables S1 and S2 (see also Figure S4).
FIGURE 3:
FIGURE 3:
Knockdown of novel components influence the Akt signaling network. (A) U2OS cells expressing EGFP-FOXO1a were treated with 40 nM of the indicated siRNA duplex (TSPAN9, 5′-GCAAAAGCCUAGUGCAUUG-3′ and 5′-UGGGUUGGGUGGCGAUUAU-3′; ITGAV, 5′-CCAUGUAGAUCACAAGAUA-3′ and 5′- CGACAAAGCUGAAUGG­AUU-3′; SON, 5′- CAAUGUCAGUGGAGUAUCA-3′ and 5′-GAUACAGAACUACGAUAUA-3′; UCP5, 5′-UGCCAUC­GUUGUAGGAGUA-3′ and 5′-GGAAUGAUGGGCGAUACAA-3′; SNAT3, 5′-AGAAGGAGCCUGCAAGAUC-3′ and 5′-GGUCAUCGGUGCCACAUCU-3′). The lysates were then subjected to SDS–PAGE and Western blot analysis. The antibodies used are labeled to right of each blot. (B) Densitometry analysis of P-S473-Akt over total Akt from part (A). Statistics were calculated for multiple experiments (n = 4). Student's t test was performed for comparison of test to control siRNAs (*p < 0.05). (C) RNAi for UCP5 and scrambled control were performed in cells stably expressing pcDNA, Flag-UCP5, or Flag-UCP5-siRNA–insensitive mutant (Flag-UCP5-siMut). Cell lysates were blotted with the antibodies labeled next to each blot. Densitometry for P-S473-Akt was normalized to GAPDH and total Akt. Student's t test was used to compare test to control siRNAs for each transfection set (* P < 0.01; see also Figure S5).
FIGURE 4:
FIGURE 4:
Knockdown of UCP5 causes ROS production and changes in the mitochondria membrane potential (MMP). (A) Network map of validated screen hits associated with UCP5 were created using Ingenuity Pathway Analysis software (Ingenuity Systems); ○ genes not affecting FOXO1a localization; siRNA targets affecting FOXO1a localization; siRNA targets affecting FOXO1a/Rev localization. Edge relationships: protein–protein interaction; expression; localization; activation; phosphorylation; regulation of binding. (B) HPLC analysis of metabolites extract from U2OS EGFP-FOXO1a cells. ATP:ADP ratios were normalized to siRNA control (n = 6). Student's t test was used to compare UCP5 to control siRNA (*p < 0.05). (C) Knockdown cells are stained with TMRE-labeled active mitochondria. TMRE was detected by flow cytometry. Log PE was recorded versus histogram percentages of 10,000 cells. Representative results of at least three independent experiments were used. (D) Images of U2OS EGFP-FOXO1a cells treated with labeled siRNA and then stained with TMRE. Knockdown of UCP5 increases uncoupling, which decreases TMRE incorporation. Representative results of at least three independent experiments were used. (E) Quantization of cells stained with TMRE from part (D). (F) Real-time PCR of UCP mRNAs from cells treated with labeled knockdown. Representative results of at least three independent experiments were used. Student's t test was used to compare test to control siRNA (*p < 0.05). (G) U2OS cells were treated with labeled siRNA, then DCF-DA (light lines), and used for flow cytometry. Log FITC was recorded versus histogram percentages of 10,000 cells. Cells were additionally treated with H2O2 in the lower panel (light lines). Untreated cells were represented as darker lines in both panels. Representative results of at least three independent experiments were used. (H) Real-time PCR SOD2 mRNA from cells treated with labeled knockdown. Representative results of at least three independent experiments were used. Student's t test was used to compare test to control siRNAs (*p < 0.05; see also Table S3).
FIGURE 5:
FIGURE 5:
UCP5 loss up-regulates UCP3 and is connected to Akt/FOXO1a through JNK1 activity. (A) U2OS EGFP-FOXO1a cells are treated with UCP5 duplex alone, UCP3 SMARTpool, UCP3 plus UCP5, or control siRNAs for 96 h, then treated with TMRE for flow cytometry analysis of MMP. Log PE was recorded vs. histogram percentages of 10,000 cells. Representative results of at least three independent experiments were used. (B) Real-time PCR of UCP isoforms and SOD2 mRNAs from cells treated with labeled knockdown. Representative results of at least three independent experiments were used. Student's t test was used to compare test to control siRNA (*p < 0.01). (C) U2OS cells were treated with labeled siRNA and DCF-DA, and used for flow cytometry. Log FITC was recorded versus histogram percentages of 10,000 cells. Representative results of at least three independent experiments were used. (D) Western blot of RNAi knockdown of UCP5 and/or UCP3 compared to control siRNA. Antibody labels appear on the right. Representative results of at least three independent experiments were used. (E) Nuclear translocation analysis of EGFP-FOXO1a after siRNA knockdown of UCP3 and/or UCP5. Representative results of at least three independent experiments were used. Student's t test was used to compare UCP5 siRNA to UCP3/UCP5 siRNA (*p < 0.01). (F) Western blot of RNAi knockdown of UCP5 and/or JNK1 compared to nontargeting control siRNA. Antibody labels appear on the right. Representative results of at least three independent experiments were used. (G) Nuclear translocation analysis of EGFP-FOXO1a after siRNA knockdown of UCP5 and/or JNK1 compared to nontargeting control siRNA. Representative results of at least three independent experiments were used. Student's t test was used to compare UCP5 siRNA to JNK1/UCP5 siRNA (*p < 0.01).
FIGURE 6:
FIGURE 6:
Mitochondrial function is connected to Akt through UCP5. Under normal growth conditions, Akt is actively sequestering phosphorylated FOXO in the cytoplasm. Mitochondria (green box) are operating properly to provide ATP for cellular energy consumption. After RNAi of UCP5, cells increase UCP3 expression, decreasing the MMP, which leads to aberrant ATP synthase production and increased stress on the ETC (e chain) elevating free radical concentration (DCF-DA increase) and oxidative stress (O2*). ATP:ADP ratio decreases due to the activity of adenylate kinase activity (AK), which produces ATP and AMP () in order to maintain high cellular ATP levels. Increased ROS production activates JNK1 and promotes nuclear FOXO1a localization via dephosphorylation of Akt. FOXO's transcriptional activity controls expression of target genes such as mitochondrial SOD2 in order to battle ROS.

Similar articles

Cited by

References

    1. Ahn EY, Yan M, Malakhova OA, Lo MC, Boyapati A, Ommen HB, Hines R, Hokland P, Zhang DE. Disruption of the NHR4 domain structure in AML1-ETO abrogates SON binding and promotes leukemogenesis. Proc Natl Acad Sci USA. 2008;105:17103–17108. - PMC - PubMed
    1. Aldaye FA, Senapedis WT, Silver PA, Way JC. A structurally tunable DNA-based extracellular matrix. J Am Chem Soc. 2010;132:14727–14729. - PMC - PubMed
    1. Amat R, Solanes G, Giralt M, Villarroya F. SIRT1 is involved in glucocorticoid-mediated control of uncoupling protein-3 gene transcription. J Biol Chem. 2007;282:34066–34076. - PubMed
    1. Barthel A, Schmoll D, Unterman TG. FoxO proteins in insulin action and metabolism. Trends Endocrinol Metab. 2005;16:183–189. - PubMed
    1. Berdichevsky A, Guarente L, Bose A. Acute oxidative stress can reverse insulin resistance by inactivation of cytoplasmic JNK. J Biol Chem. 2010;285:21581–21589. - PMC - PubMed

Publication types

MeSH terms