. 2011 May 15;22(10):1780-90.
doi: 10.1091/mbc.E10-09-0783. Epub 2011 Apr 1.

Phosphorylation of STEF/Tiam2 by protein kinase A is critical for Rac1 activation and neurite outgrowth in dibutyryl cAMP-treated PC12D cells

Affiliations

Phosphorylation of STEF/Tiam2 by protein kinase A is critical for Rac1 activation and neurite outgrowth in dibutyryl cAMP-treated PC12D cells

Akihiro Goto et al. Mol Biol Cell. .

Abstract

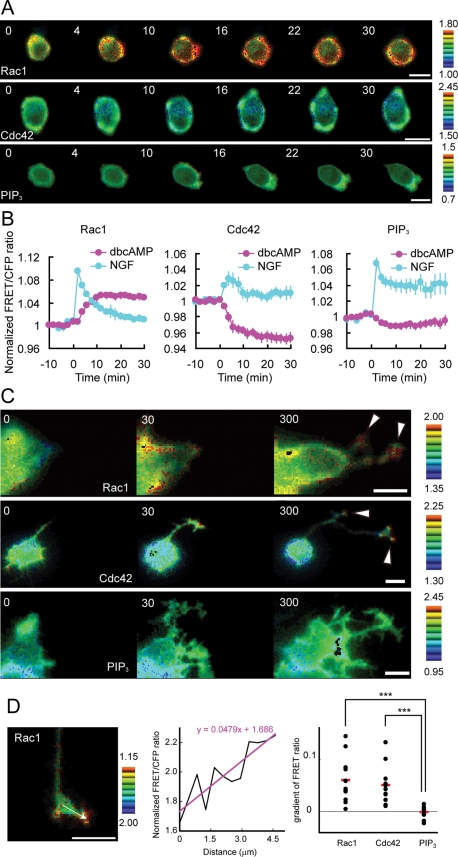
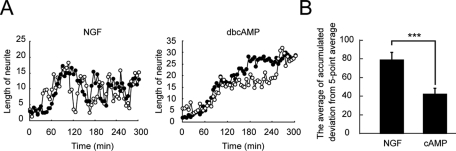
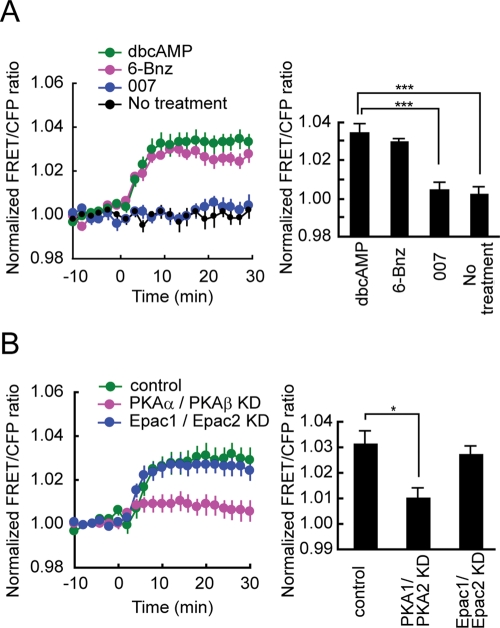
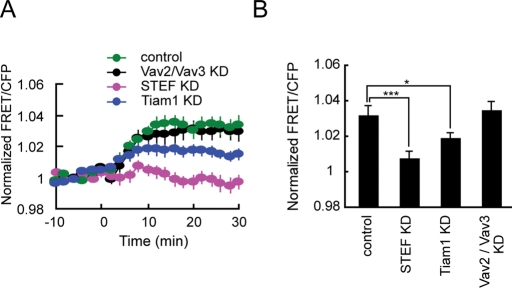
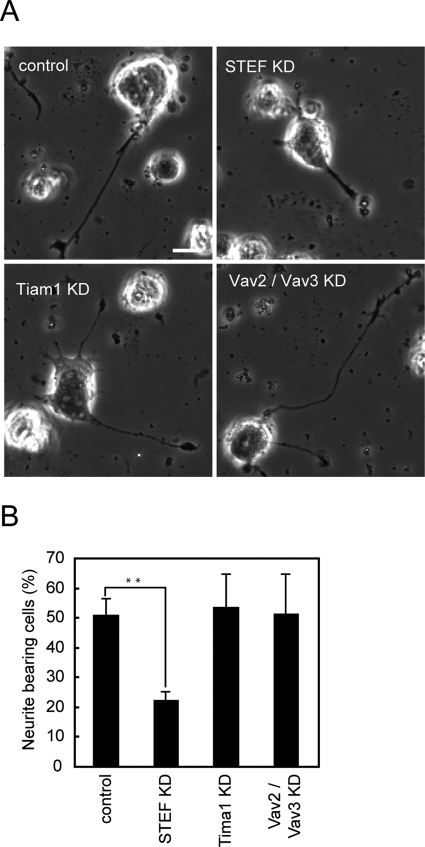
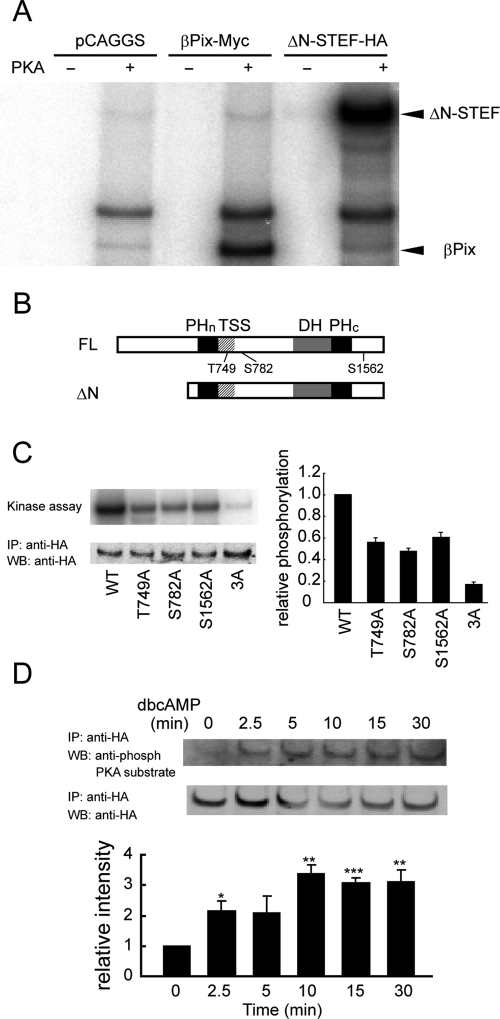
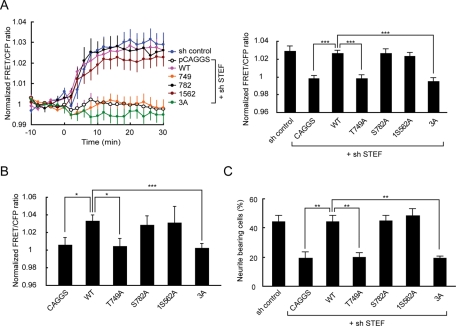
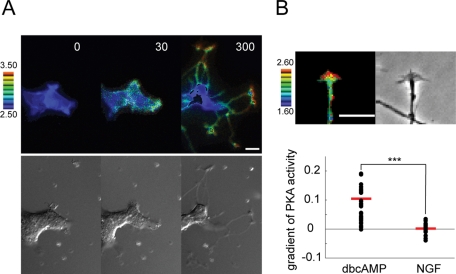
The second messenger cAMP plays a pivotal role in neurite/axon growth and guidance, but its downstream pathways leading to the regulation of Rho GTPases, centrally implicated in neuronal morphogenesis, remain elusive. We examined spatiotemporal changes in Rac1 and Cdc42 activity and phosphatidylinositol 3,4,5-triphosphate (PIP(3)) concentration in dibutyryl cAMP (dbcAMP)-treated PC12D cells using Förster resonance energy transfer-based biosensors. During a 30-min incubation with dbcAMP, Rac1 activity gradually increased throughout the cells and remained at its maximal level. There was no change in PIP(3) concentration. After a 5-h incubation with dbcAMP, Rac1 and Cdc42 were activated at the protruding tips of neurites without PIP(3) accumulation. dbcAMP-induced Rac1 activation was principally mediated by protein kinase A (PKA) and Sif- and Tiam1-like exchange factor (STEF)/Tiam2. STEF depletion drastically reduced dbcAMP-induced neurite outgrowth. PKA phosphorylates STEF at three residues (Thr-749, Ser-782, Ser-1562); Thr-749 phosphorylation was critical for dbcAMP-induced Rac1 activation and neurite extension. During dbcAMP-induced neurite outgrowth, PKA activation at the plasma membrane became localized to neurite tips; this localization may contribute to local Rac1 activation at the same neurite tips. Considering the critical role of Rac1 in neuronal morphogenesis, the PKA-STEF-Rac1 pathway may play a crucial role in cytoskeletal regulation during neurite/axon outgrowth and guidance, which depend on cAMP signals.


Figures

FIGURE 1:
FIGURE 1:
Spatiotemporal changes in Rac1 and Cdc42 activity and PIP3 concentration following dbcAMP treatment. (A and B) PC12D cells expressing Raichu-Rac1, Raichu-Cdc42, or Pippi-PIP3 were starved for 2 h and then treated with 1 mM dbcAMP. Images were obtained every 2 min for 30 min after dbcAMP addition. (A) Representative ratio images of FRET/CFP at the indicated time points (in min) after dbcAMP addition are shown in the intensity-modulated display mode. In the intensity-modulated display mode, eight colors from red to blue are used to represent the FRET/CFP ratio, with the intensity of each color indicating the mean intensity of FRET and CFP. The upper and lower limits of the ratio images are shown on the right. Bars, 10 μm. (B) The mean FRET/CFP ratios averaged over the whole cell are expressed by measuring the relative increase compared with the reference value, which was averaged over10 min before dbcAMP addition. The number of experiments was as follows: Rac1 (n = 20), Cdc42 (n = 9), PIP3 (n = 21). Error bars show the SE. (C) The long-term response of Rac1 and Cdc42 activity and PIP3 concentration following dbcAMP treatment was examined as described for (A). Images were obtained every 5 min for 5 h after dbcAMP addition. Representative ratio images of FRET/CFP at the indicated time points (in min) after dbcAMP addition are shown as described for (A). Bars, 10 μm. (D) Images were obtained every 5 min for 1 h after a 1-d treatment with dbcAMP. A gradient of normalized FRET/CFP ratio measured by line scanning in neurite tips (left) was obtained by linear fitting (middle) and plotted for Rac1 and Cdc42 activity and PIP3 concentration (right). The number of experiments was as follows: Rac1 (n = 12), Cdc42 (n = 11), PIP3 (n = 10). Red bars represent averages. The symbols indicate the results of a Student's t test analysis (***p < 0.001).
FIGURE 2:
FIGURE 2:
Different modes of neurite outgrowth in NGF- and dbcAMP-treated PC12D cells. PC12D cells were treated with NGF or dbcAMP and imaged every 5 min for 5 h. The length of the longest neurites was measured for each image. The number of experiments was as follows: NGF (n = 12), dbcAMP (n = 12). (A) Two representative time-dependent changes in neurite length are shown for NGF-treated cells (left) and dbcAMP-treated cells (right). (B) The bar graph shows the average of accumulated deviation from the five-point average, with SE. The symbol indicates the result of a Student's t test (***p < 0.001).
FIGURE 3:
FIGURE 3:
Comparison between PKA and Epac in the contribution to dbcAMP-induced Rac1 activation. (A) PC12D cells expressing Raichu-Rac1 were starved for 2 h and then mock-treated or treated with 1 mM dbcAMP, 100 μM 6-Bnz-cAMP, or 100 μM 007. Images were obtained every 2 min for 30 min after drug treatment. The number of experiments was as follows: dbcAMP (n = 20), 6-Bnz-cAMP (n = 12), 007 (n = 14), mock-treated (n = 10). Left, the mean FRET/CFP ratios averaged over the whole cell are expressed as in the legend to Figure 1B. Error bars show the SE. Right, the bar graph represents the average of the highest values of Rac1 activation in the indicated samples with SE. The symbols indicate the results of a Student's t-test analysis (***p < 0.001). (B) PC12D cells were transfected with an empty pSUPER vector, both pSUPER-PRKACA and pSUPER-PRKACB, or both Epac1 and Epac2. After selection with puromycin, the cells were further transfected with pRaichu-Rac1. After starvation for 2 h, images were obtained every 2 min for 30 min after dbcAMP addition. The number of experiments was as follows: control (n = 18), PRKACA and PRKACB KD (n = 13), Epac1/Epac2 KD (n = 16). Left, the mean FRET/CFP ratios averaged over the whole cell are expressed as in the legend to Figure 1B. Error bars show the SE. Right, the bar graph represents the average of the highest values of Rac1 activation in the indicated samples, with SE. The symbol indicates the result of a Student's t test (*p < 0.05).
FIGURE 4:
FIGURE 4:
Effect of depletion of STEF, Tiam1, or Vav2/Vav3 on dbcAMP-induced Rac1 activation. PC12D cells were transfected with an empty pSUPER vector, pSUPER-STEF, pSUPER-Tiam1, or both pSUPER-Vav2 and pSUPER-Vav3. After selection with puromycin, the cells were further transfected with pRaichu-Rac1. After starvation for 2 h, images were obtained every 2 min for 30 min after dbcAMP addition. The number of experiments is as follows: control (n = 18), STEF KD (n = 12), Tiam1 KD (n = 12), Vav2/Vav3 KD (n = 20). (A) The mean FRET/CFP ratios averaged over the whole cell are expressed as in the legend to Figure 1B. Error bars show SE. (B) A bar graph represents the average of the highest values of Rac1 activation in the indicated samples with SE. The symbols indicate the results of a Student's t test (*p < 0.05; ***p < 0.001).
FIGURE 5:
FIGURE 5:
Effect of depletion of STEF, Tiam1, or Vav2/Vav3 on dbcAMP-induced neurite outgrowth. PC12D cells were transfected with an empty pSUPER vector, pSUPER-STEF, pSUPER-Tiam1, or both pSUPER-Vav2 and pSUPER-Vav3. After recovery, the cells were incubated with puromycin for 2 d. Then the selected cells were cultured with dbcAMP for 2 d and fixed for microscopy. At least 50 cells were assessed in each experiment, and the experiments were repeated three times. (A) Representative phase-contrast images of the control cells (top left), STEF-depleted cells (top right), Tiam1-depleted cells (bottom left), and Vav2/Vav3-depleted cells (bottom right). Bars, 10 μm. (B) Cells with neurites the lengths of which were at least twofold longer than their cell body lengths were scored as neurite-bearing cells. The results are expressed as the mean percentage of neurite-bearing cells with SE. The symbol indicates the result of a Student's t test; **p < 0.01 compared with the control.
FIGURE 6:
FIGURE 6:
In vitro phosphorylation of STEF by PKA and in vivo phosphorylation of STEF following dbcAMP treatment. (A) COS-7 cells transfected with an empty pCAGGS vector, βPix-Myc–expressing plasmid, or ΔN-STEF-HA–expressing plasmid, incubated for 2 d, and lysed for immunoprecipitation with anti-HA (control and ΔN-STEF-HA) or anti-myc (βPix-Myc) antibody. The precipitated proteins were subjected to in vitro phosphorylation by PKA catalytic subunits with [γ-32P]ATP in the kinase buffer. The phosphorylated products were resolved by SDS–PAGE and subjected to autoradiography. Arrowheads represent the positions of ΔN-STEF and βPix, respectively. (B) Diagrams of full-length (FL) and ΔN mutant of STEF. PHn, N-terminal pleckstrin homology; DH, Dbl homology; PHc, C-terminal pleckstrin homology. (C) cDNA encoding ΔN-STEF-HA or its mutants was transfected into COS-7 cells. In vitro kinase assays were performed as in (A). Experiments were repeated three times. Left, representative result. Top, an autoradiogram of phosphorylated ΔN-STEF-HA or its mutants. Bottom, an immunoblot with anti-HA antibody on anti-HA immunoprecipitates. Right, the averages of the relative levels of STEF phosphorylation in the indicated samples, with SE. (D) PC12D cells expressing full-length STEF were treated with dbcAMP for the indicated times and lysed for immunoprecipitation. Top, anti-HA immunoprecipitates were probed with anti-phospho PKA substrate or anti-HA antibody. Bottom, the averages of the relative levels of STEF phosphorylated by PKA, with SE (n = 3). The level of STEF phosphorylation in untreated cells was set to 1. The symbol indicates the result of a Student's t test (*p < 0.05; **p < 0.01; ***p < 0.001).
FIGURE 7:
FIGURE 7:
Identification of a critical PKA phosphorylation site on STEF for dbcAMP-induced Rac1 activation and neurite outgrowth. (A) PC12D cells were transfected with pCAGGS-3HA-resi-STEF-WT or its mutants in combination with pSUPER-STEF. After selection with puromycin, the cells were further transfected with pRaichu-Rac1. After starvation for 2 h, images were obtained every 2 min for 30 min after dbcAMP treatment. Left, time-course of the mean FRET/CFP ratios averaged over the whole cell. The number of experiments was as follows: control (n = 18), pCAGGS (n = 28), WT (n = 33), Thr-749A (n = 36), Ser-782A (n = 19), Ser-1562A (n = 18), 3A (n = 17). Error bars show the SE. Right, the bar graph represents the average of the highest values of Rac1 activation in the indicated samples, with SE. The symbols indicate the results of a Student's t test (***p < 0.001). (B) COS-7 cells were transfected with pCAGGS-3HA-resi-STEF-WT or its mutants in combination with pRaichu-Rac1. After starvation for 2 h, images were obtained every 2 min for 30 min after dbcAMP treatment. The bar graph represents the average of the highest values of the normalized FRET/CFP ratios during the 30 min in the indicated samples, with SE. The number of experiments was as follows: pCAGGS (n = 30), WT (n = 49), Thr-749A (n = 15), Ser-782A (n = 9), Ser-1562A (n = 16), 3A (n = 13). The symbols indicate the results of a Student's t test (*p < 0.05, ***p < 0.001). (C) PC12D cells were transfected with pCAGGS-3HA-resi-STEF-WT or its mutants in combination with pSUPER-STEF. After recovery, the cells were incubated with puromycin for 2 d, and then fixed for microscopy. Cells with neurites the lengths of which were at least twofold longer than their cell body lengths were scored as neurite-bearing cells. At least 50 cells were assessed in each experiment, and the experiments were repeated three times. The results are expressed as the mean percentage of neurite-bearing cells, with SE. The symbols indicate the results of a Student's t test (**p < 0.01).
FIGURE 8:
FIGURE 8:
Spatiotemporal changes in PKA activity following dbcAMP treatment. (A) PC12D cells expressing pmAKAR3 were starved for 2 h and then treated with 1 mM dbcAMP. Images were obtained every 5 min for 300 min after dbcAMP addition (n = 12). Representative ratio images of FRET/CFP at the indicated time points (in min) after dbcAMP addition are shown as in the legend to Figure 1A. Bars, 10 μm. (B) PC12D cells expressing pmAKAR3 were incubated with 1 mM dbcAMP for 1 d, and then images were obtained every 2 min for 40 min. Top, a representative ratio image of FRET/CFP in neurite tips is shown. Bars, 10 μm. Bottom, distributions of gradients of PKA activity in dbcAMP- or NGF-induced neurite tips. Red bars represent averages.

Similar articles

Cited by

References

    1. Aglah C, Gordon T, Posse de Chaves EI. cAMP promotes neurite outgrowth and extension through protein kinase A but independently of Erk activation in cultured rat motoneurons. Neuropharmacol. 2008;55:8–17. - PubMed
    1. Allen MD, Zhang J. Subcellular dynamics of protein kinase A activity visualized by FRET-based reporters. Biochem Biophys Res Commun. 2006;348:716–721. - PubMed
    1. Aoki K, Nakamura T, Fujikawa K, Matsuda M. Local phosphatidylinositol 3,4,5-trisphosphate accumulation recruits Vav2 and Vav3 to activate Rac1/Cdc42 and initiate neurite outgrowth in nerve growth factor-stimulated PC12 cells. Mol Biol Cell. 2005;16:2207–2217. - PMC - PubMed
    1. Aoki K, Nakamura T, Inoue T, Meyer T, Matsuda M. An essential role for the SHIP2-dependent negative feedback loop in neuritogenesis of nerve growth factor-stimulated PC12 cells. J Cell Biol. 2007;177:817–827. - PMC - PubMed
    1. Aoki K, Nakamura T, Matsuda M. Spatio-temporal regulation of Rac1 and Cdc42 activity during nerve growth factor-induced neurite outgrowth in PC12 cells. J Biol Chem. 2004;279:713–719. - PubMed

Publication types

MeSH terms