. 2011 Jul;301(1):H48-60.
doi: 10.1152/ajpheart.00133.2011. Epub 2011 Apr 1.

Determinants of valve gating in collecting lymphatic vessels from rat mesentery

Affiliations

Determinants of valve gating in collecting lymphatic vessels from rat mesentery

Michael J Davis et al. Am J Physiol Heart Circ Physiol. 2011 Jul.

Abstract

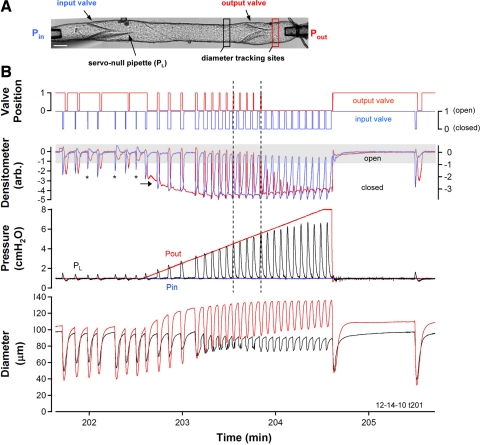
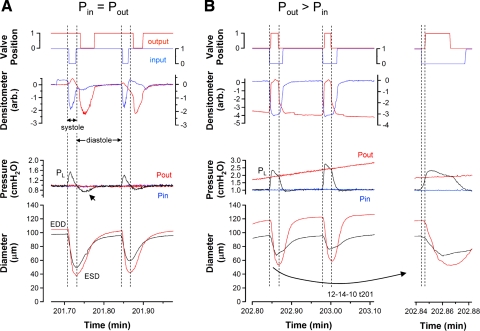
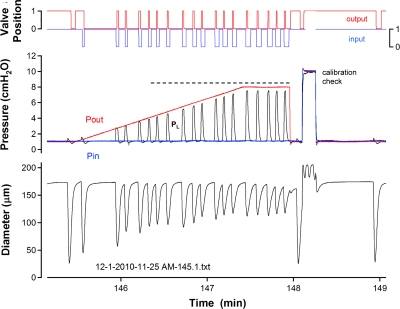
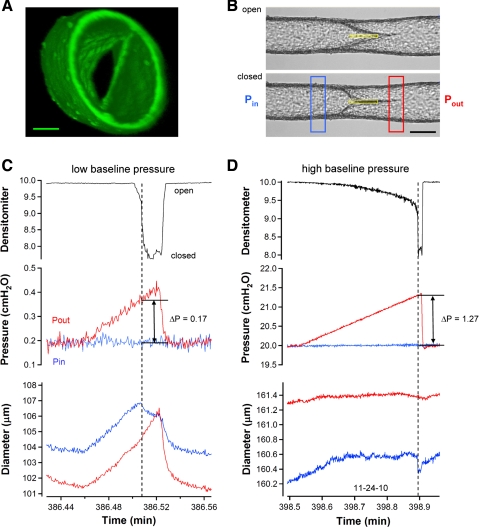
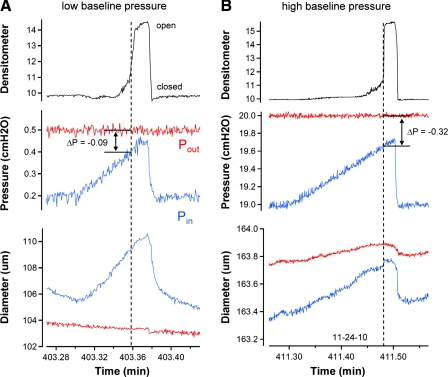
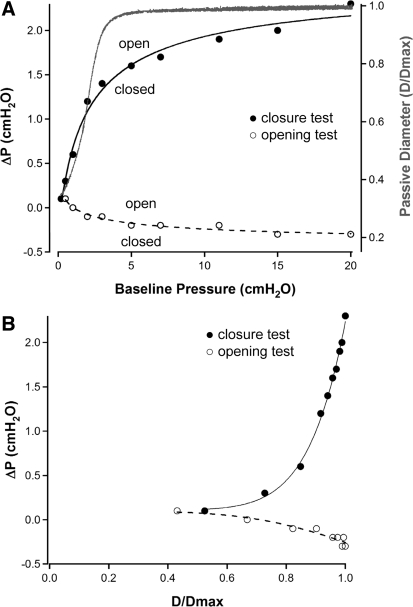
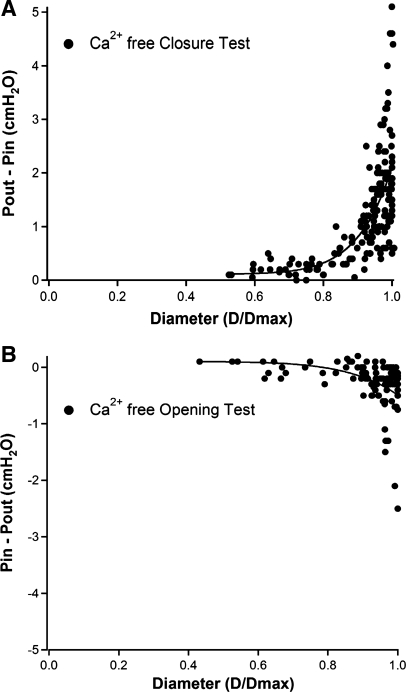
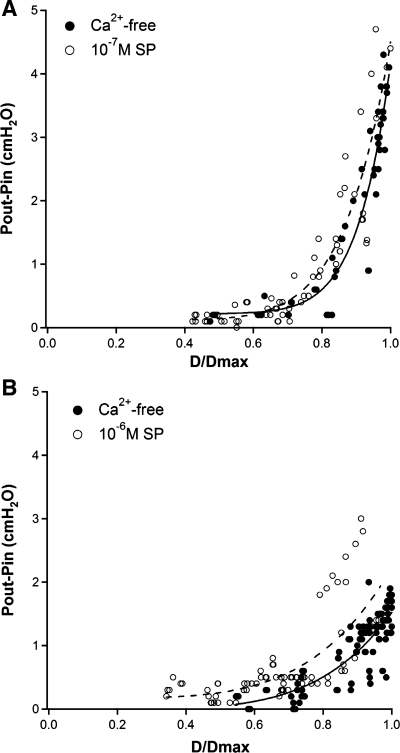
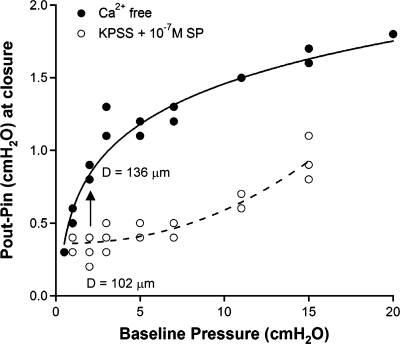
Secondary lymphatic valves are essential for minimizing backflow of lymph and are presumed to gate passively according to the instantaneous trans-valve pressure gradient. We hypothesized that valve gating is also modulated by vessel distention, which could alter leaflet stiffness and coaptation. To test this hypothesis, we devised protocols to measure the small pressure gradients required to open or close lymphatic valves and determine if the gradients varied as a function of vessel diameter. Lymphatic vessels were isolated from rat mesentery, cannulated, and pressurized using a servo-control system. Detection of valve leaflet position simultaneously with diameter and intraluminal pressure changes in two-valve segments revealed the detailed temporal relationships between these parameters during the lymphatic contraction cycle. The timing of valve movements was similar to that of cardiac valves, but only when lymphatic vessel afterload was elevated. The pressure gradients required to open or close a valve were determined in one-valve segments during slow, ramp-wise pressure elevation, either from the input or output side of the valve. Tests were conducted over a wide range of baseline pressures (and thus diameters) in passive vessels as well as in vessels with two levels of imposed tone. Surprisingly, the pressure gradient required for valve closure varied >20-fold (0.1-2.2 cmH(2)O) as a passive vessel progressively distended. Similarly, the pressure gradient required for valve opening varied sixfold with vessel distention. Finally, our functional evidence supports the concept that lymphatic muscle tone exerts an indirect effect on valve gating.


Figures

Fig. 1.
Fig. 1.
A: video montage of the isolated lymphatic vessel preparation, showing the positions of the input, output, and servo-null pipettes relative to the 2 valves. Black and red rectangles indicate the approximate positions of the diameter tracking windows in the central and output segments, respectively. Shadow at bottom left is caused by the servo-null pipette. Pin, input pipette pressure; Pout, output pipette pressure; PL, intraluminal pressure in the central segment; arb., arbitrary units. Calibration bar = 100 μm. B: representative record of the lymphatic response to ramp-wise elevation in Pout. Initially, Pin and Pout were both set to 1 cmH2O and, after 7 spontaneous contractions, a Pout ramp to 8 cmH2O (at 4 cmH2O/min) was imposed. Bottom trace: time course of the inner diameter changes in the central segment (black) and the output segment (red). Pressure traces show Pin (blue), Pout (red), and PL (black) superimposed on a common scale. As the Pout ramp progressed, greater intraluminal systolic pressures were developed by the central segment during each contraction cycle but diastolic pressure returned to 1 cmH2O each cycle. Top two traces: net densitometer signals recorded from pairs of windows positioned over the midlines of each valve region (see methods for details and representative window positions in Supplemental Fig. S1), where blue is position of the input valve leaflets and red is position of the output valve leaflets. Top traces: open and closed positions of the respective valves obtained after applying a threshold window to the densitometer traces (any signal below the lower edge of the window corresponds to a closed valve). *Contraction cycle in which the output valve did not transiently close. This experiment represents the response of 9 different vessels.
Fig. 2.
Fig. 2.
Expanded views of selected contractions from the recording in Fig. 1 show the timing of the input and output valves at different levels of Pout. Traces are the same as described in Fig. 1. A: lymphatic contraction cycle when Pin = Pout (1 cmH2O). Vertical lines denote the periods of systole, as determined from the diameter recordings. B: lymphatic contraction cycle when Pout > Pin. Vertical lines denote the periods of systole, as determined from the diameter recordings. B, inset: first contraction with an expanded time scale; here the dotted vertical lines denote a period of isovolumic systole. ESD, end systolic diameter; EDD, end diastolic diameter.
Fig. 3.
Fig. 3.
Example recording from a vessel that was able to eject for every contraction during a Pout ramp. Horizontal dotted line corresponds to contractions that resulted in opening of the output valve without peak systolic PL equaling or exceeding Pout. At the end of the ramp, Pin and Pout were elevated simultaneously to 10 cmH2O to check the calibration of the pipette used to measure PL.
Fig. 4.
Fig. 4.
Valve closure tests performed on a single-valve vessel in Ca2+-free solution. A: confocal reconstruction of a secondary valve in a rat mesenteric lymphatic obtained in Ca2+-free solution to prevent contractions. View is taken from downstream, looking back (against normal flow) into the valve. Structures at 1 o'clock and 7 o'clock at the inner edge of the lumen are the valve insertion points, or buttresses. Calibration bar = 40 μm. B: images of a representative vessel with the valve in the open (top) and closed (bottom) positions. Single densitometer window used to detect valve leaflet position is shown in yellow. Calibration bar = 120 μm. C and D: densitometer, pressure, and diameter traces are similar to those described in previous figures (no PL recordings were necessary under these conditions because all pressures could be controlled). Tests begin with Pin (red trace) and Pout (blue trace) equal in which case the valve is open. A ramp-wise increase in Pout is imposed until the valve closes. Pout and Pin levels at the instant of closure are recorded and the difference (Pout − Pin) is the minimal pressure gradient required for closure. Diameter traces on both sides of the valve are recorded at sites corresponding to the colored windows in B. Test in C starts at the lowest baseline pressure level used (0.2 cmH2O), whereas the test in D starts at the highest level of baseline pressure used (20 cmH2O). Both recordings are from the same vessel. Note the difference in the diameter and pressure scales between C and D.
Fig. 5.
Fig. 5.
Valve opening tests performed on a single-valve vessel in Ca2+-free solution. A: valve opening test at a low baseline pressure. Densitometer, pressure, and diameter traces are similar to those described in previous figures. Blue traces are the respective recordings on the input side of the valve, and red traces are the respective recordings on the output side of the valve. Test begins with Pout sufficiently higher than Pin to maintain a closed valve. A ramp-wise increase in Pin is imposed until the valve opens. Pout and Pin levels at that instant are recorded and the difference (Pin − Pout) is the minimal pressure gradient required for opening. This value was typically negative as shown here. B: valve opening test is repeated at the highest level of Pout used (20 cmH2O). Both A and B are from the same vessel. Note the difference in the diameter and pressure scales between the 2 panels.
Fig. 6.
Fig. 6.
Summary of valve closure and opening tests for one lymphatic vessel. A, left axis: pressure gradient required for valve closure (Pout − Pin; ●) or opening (Pin − Pout; ○) plotted as a function of baseline pressure. Each point is the average ΔP (Pout − Pin) for 3 trials. Right axis: continuous pressure diameter relationship for the same vessel determined from a simultaneous Pin + Pout ramp from 0.2 to 20 cmH2O in Ca2+-free PSS after valve gating tests were completed; data were normalized to the passive diameter at 20 cmH2O. B: pressure gradient required for valve closure (Pout − Pin; ●) or opening (Pin − Pout; ○) plotted as a function of normalized diameter. All measurements were made in Ca2+-free PSS. All curve fits are power functions. D/Dmax, passive diameter/maximum passive diameter.
Fig. 7.
Fig. 7.
Summary of measurements describing the pressure gradient required for valve closure (A; n = 17) or valve opening (B; n = 10) as a function of normalized diameter.
Fig. 8.
Fig. 8.
Summary of valve closure measurements (○) after imposing a moderate (A) or high (B) level of tone using high K+ physiological saline solution (KPSS) + substance P (SP). Concentration of SP was 10−7 M for all vessels in A, 6 × 10⁻⁷ M for 2 vessels in B and 1 × 10⁻⁶ M for the other 2 vessels in B. Measurements in same vessels at same baseline pressures in Ca2+-free PSS are shown (●). Dotted lines are curve fit for SP data; solid lines are curve fit for Ca2+-free data (n = 4 for A and B); curve fit parameters are listed in Supplemental Table S1.
Fig. 9.
Fig. 9.
Plot of the trans-valve pressure gradient at the moment of valve closure as a function of baseline (initial) pressure. Graph represents an alternative way to express the closure test data for 1 of the 4 vessels used in Fig. 8B (∼50% tone group). Complete data sets for all 4 vessels are plotted in a similar manner in Supplemental Fig. S6. Arrow indicates the increase in the adverse pressure gradient required to close the valve if the vessel were to lose all tone at a constant lumenal pressure of 2 cmH2O. Diameters indicated are the averages calculated from the respective trials (with and without tone) at 2 cmH2O.

References

    1. Albertine KH, Fox LM, O'Morchoe CC. The morphology of canine lymphatic valves. Anatomical Record 202: 453–461, 1982 - PubMed
    1. Benoit JN, Zawieja DC, Goodman AH, Granger HJ. Characterization of intact mesenteric lymphatic pump and its responsiveness to acute edemagenic stress. Am J Physiol Heart Circ Physiol 257: H2059–H2069, 1989 - PubMed
    1. Bertram CD, Macaskill C, Moore JE. Simulation of a chain of collapsible contracting lymphangions with progressive valve closure. J Biomechem Engineering 133: 011008, 2011 - PMC - PubMed
    1. Borisov AV. [Functional anatomy of lymphangion]. Morfologiia 128: 18–27, 2005 - PubMed
    1. Borisov AV. [The theory of the design of the lymphangion]. Morfologiia 112: 7–17, 1997 - PubMed

Publication types

LinkOut - more resources