. 2011 May 27;286(21):18538-46.
doi: 10.1074/jbc.M110.214510. Epub 2011 Apr 1.

Enhancement of the rate of pyrophosphate hydrolysis by nonenzymatic catalysts and by inorganic pyrophosphatase

Affiliations

Enhancement of the rate of pyrophosphate hydrolysis by nonenzymatic catalysts and by inorganic pyrophosphatase

Randy B Stockbridge et al. J Biol Chem. .

Abstract

To estimate the proficiency of inorganic pyrophosphatase as a catalyst, (31)P NMR was used to determine rate constants and thermodynamics of activation for the spontaneous hydrolysis of inorganic pyrophosphate (PP(i)) in the presence and absence of Mg(2+) at elevated temperatures. These values were compared with rate constants and activation parameters determined for the reaction catalyzed by Escherichia coli inorganic pyrophosphatase using isothermal titration calorimetry. At 25 °C and pH 8.5, the hydrolysis of MgPP(i)(2-) proceeds with a rate constant of 2.8 × 10(-10) s(-1), whereas E. coli pyrophosphatase was found to have a turnover number of 570 s(-1) under the same conditions. The resulting rate enhancement (2 × 10(12)-fold) is achieved entirely by reducing the enthalpy of activation (ΔΔH(‡) = -16.6 kcal/mol). The presence of Mg(2+) ions or the transfer of the substrate from bulk water to dimethyl sulfoxide was found to increase the rate of pyrophosphate hydrolysis by as much as ∼ 10(6)-fold. Transfer to dimethyl sulfoxide accelerated PP(i) hydrolysis by reducing the enthalpy of activation. Mg(2+) increased the rate of PP(i) hydrolysis by both increasing the entropy of activation and reducing the enthalpy of activation.


Figures
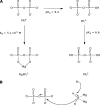
FIGURE 1.
FIGURE 1.
A, rate constants for the hydrolysis of PPi4−, PPi3−, PPi2−, and MgPPi2− were determined in this work. The Kd or pKa values are shown for each species. The conformation of MgPPi2− that is shown is the most stable in solution, although not necessarily the reactive species. B, reaction diagram for the proposed enzyme reaction. In the PPase active site, the nucleophilic water molecule is thought to be coordinated by two Mg2+ ions, which lower the pKa of the water molecule, facilitating proton transfer to a base within the active site. The hydrolysis reaction is hypothesized to proceed through an associative mechanism, in which the attack by the nucleophile occurs prior to the phosphate-phosphate bond breaking. In this work, the thermodynamic effect of the two Mg2+ ions on water deprotonation was examined.
FIGURE 2.
FIGURE 2.
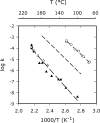
Arrhenius plots of the rate constants for the hydrolyses of PPi2− at pH 5.0 (○) and PPi4− in 1 m KOH (▴) and 2 m KOH (△). For comparison, the expected location of an Arrhenius plot of the rate constants for the hydrolysis of PPi3−, determined from the estimated activation parameters, is shown as a dashed line.
FIGURE 3.
FIGURE 3.
Relationship between pH and ΔG at 25 °C (left panel) or ΔH (right panel) of PPi hydrolysis. ΔG and ΔH values were estimated from Arrhenius plots obtained at each pH value. The solid lines represent the best fits to Equation 1.
FIGURE 4.
FIGURE 4.
Arrhenius plot of the rate constants for the hydrolysis of MgPPi2−. Data points were obtained under three different sets of experimental conditions: 1 × 10⁻² m Mg2+, 2 × 10⁻³ m PPi, and 1 × 10⁻² m ethyl phosphonate (pH 7.5), measured with 31P NMR (green circles); 1 × 10⁻² m Mg2+, 2 × 10⁻³ m PPi, and 2 × 10⁻³ m ethyl phosphonate (pH 8.0), measured with the acid-molybdate assay (blue triangles); and 2 × 10⁻⁴ m Mg2+, 2 × 10⁻⁵ m PPi, and 2 × 10⁻³ m sodium borate (pH 8.7), measured with the acid-molybdate assay (white squares).
FIGURE 5.
FIGURE 5.
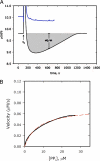
Measurement of kcat using isothermal titration calorimetry. A, the reaction was initiated by injecting 5 × 10⁻³ ml of PPi into 1.45 ml of reaction mixture (positive spike at 100 s). The upper trace (blue) shows the instrument output in the absence of PPase. When PPase is present in the reaction mixture (lower trace, black), heat is generated in proportion to substrate turnover. The velocity (dP/dt) at any time t was determined using Equation 4. An example of the measurement of dQ/dt is indicated on the plot, and the shaded region represents the total heat released by the reaction. B, velocity measurements were used to generate a continuous Michaelis-Menten plot (solid black line). Data were fit to the Michaelis-Menten equation (red dashed line) using SigmaPlot, from which kcat and Km values were extracted.
FIGURE 6.
FIGURE 6.
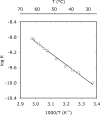
Arrhenius plot of the rate constants (kcat) for PPi hydrolysis by E. coli PPase.
FIGURE 7.
FIGURE 7.
Arrhenius plot of the rate constants for PPi hydrolysis in DMSO (●) compared with the rate constants for PPi4− hydrolysis in water (○). The rate constants for PPi hydrolysis in DMSO are for 1 m H2O and are corrected to reflect the equilibrium between PPi and PO4 that was observed under these reaction conditions (see “Results”).
FIGURE 8.
FIGURE 8.
van 't Hoff plot of the equilibrium constants for the formation of MgOH+ from MgH2O2+.

References

    1. Stockbridge R. B., Lewis C. A., Jr., Yuan Y., Wolfenden R. (2010) Proc. Natl. Acad. Sci. U.S.A. 107, 22102–22105 - PMC - PubMed
    1. Baltscheffsky H., Lundin M., Luxemburg C., Nyren P., Baltscheffsky M. (1986) Chem. Scr. 26B, 259–262
    1. Hedlund J., Cantoni R., Baltscheffsky M., Baltscheffsky H., Persson B. (2006) FEBS J. 273, 5183–5193 - PubMed
    1. Malinen A. M., Belogurov G. A., Baykov A. A., Lahti R. (2007) Biochemistry 46, 8872–8878 - PubMed
    1. Ronimus R. S., Morgan H. W. (2001) Extremophiles 5, 357–373 - PubMed

Publication types

LinkOut - more resources