. 2011 Apr;67(Pt 4):271-81.
doi: 10.1107/S0907444910048675. Epub 2011 Mar 18.

iMOSFLM: a new graphical interface for diffraction-image processing with MOSFLM

Affiliations

iMOSFLM: a new graphical interface for diffraction-image processing with MOSFLM

T Geoff G Battye et al. Acta Crystallogr D Biol Crystallogr. 2011 Apr.

Abstract

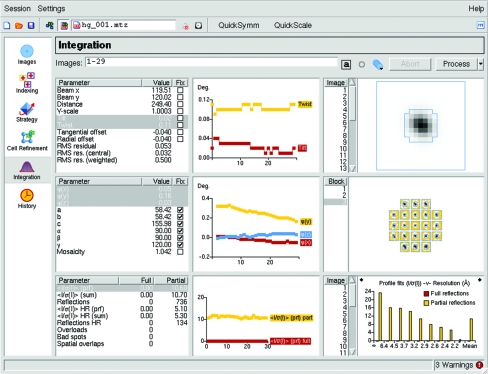
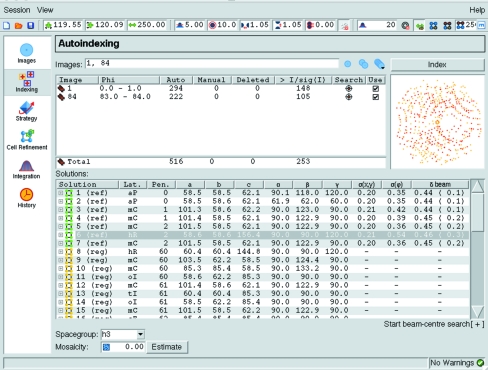
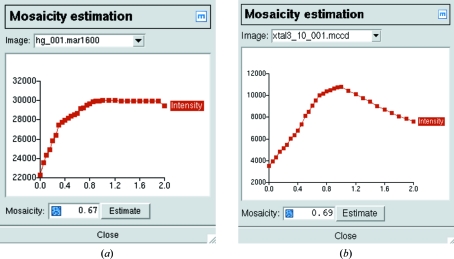
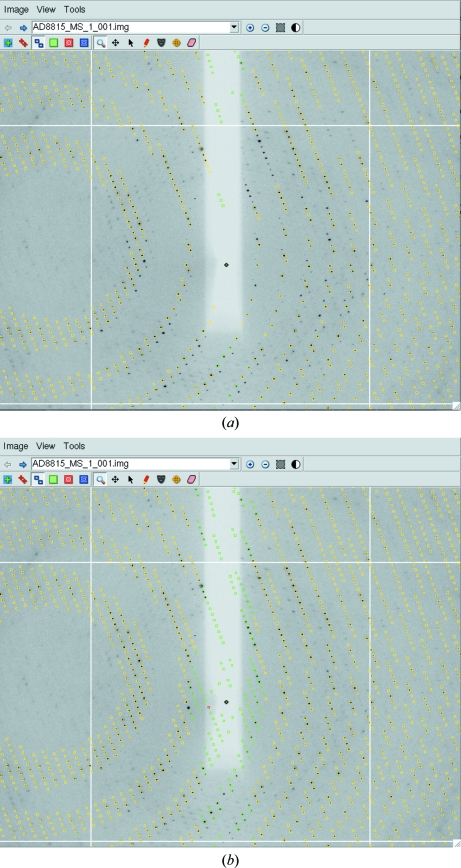
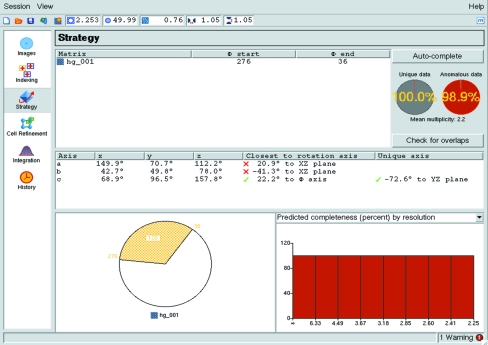
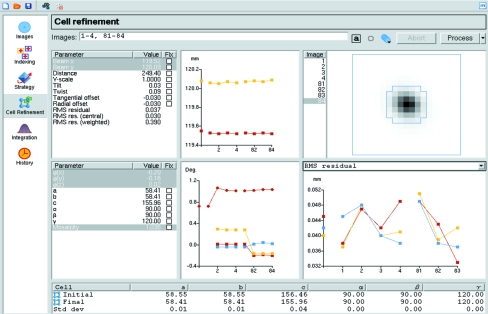
iMOSFLM is a graphical user interface to the diffraction data-integration program MOSFLM. It is designed to simplify data processing by dividing the process into a series of steps, which are normally carried out sequentially. Each step has its own display pane, allowing control over parameters that influence that step and providing graphical feedback to the user. Suitable values for integration parameters are set automatically, but additional menus provide a detailed level of control for experienced users. The image display and the interfaces to the different tasks (indexing, strategy calculation, cell refinement, integration and history) are described. The most important parameters for each step and the best way of assessing success or failure are discussed.


Figures

Figure 1
Figure 1
An overview of the iMOSFLM GUI. The Integration pane is shown and the icons for the various tasks are displayed in the vertical icon bar on the left-hand side of the window. Refined detector and crystal parameters are displayed graphically in the central upper and middle windows, respectively. Intensity statistics are displayed in the lower central and lower right-hand windows. The average spot profile for spots in the central region of the detector is shown in the upper right panel and the standard profiles for different regions of the detector are shown in the central right panel.
Figure 2
Figure 2
The iMOSFLM Image Display window. The functions of the buttons in the tool bar are explained in the main text.
Figure 3
Figure 3
The iMOSFLM Indexing pane. Parameters that influence spot finding and indexing are shown in the tool bar. Details of the images used for indexing and the number of spots found and used are presented as a table and graphically. The list of possible indexing solutions is shown, with the preferred solution highlighted.
Figure 4
Figure 4
Mosaicity estimation. The total intensity for all predicted spots is plotted as a function of the mosaic spread. (a) In most cases the total intensity will reach a plateau at the correct value for the mosaic spread. (b) With large unit cells (or large oscillation angles) the total intensity can drop rather than plateau because spatially overlapping spots are not integrated.
Figure 5
Figure 5
The effect of the mosaic block size on the predicted diffraction pattern. Reducing the mosaic block size effectively increases the apparent mosaic spread at low resolution with little or no effect at high resolution. (a) 100 µm mosaic block size. (b) 2 µm mosaic block size.
Figure 6
Figure 6
The iMOSFLM Strategy pane. Details are given in the main text.
Figure 7
Figure 7
The iMOSFLM Cell Refinement pane. In this example the refined direct-beam coordinates are plotted in the upper central graph, the refined crystal missetting angles and mosaic spread are plotted in the lower central graph and the r.m.s. residual is plotted in the lower right graph, all as a function of image number. The average spot profile for spots in the central region of the detector is displayed in the upper right panel. The initial and refined cell parameters and an estimate of their standard uncertainties are given in the table.

References

    1. Arndt, U. W. & Wonacott, A. J. (1977). Editors. The Rotation Method in Crystallography Amsterdam: North-Holland.
    1. Briggs, P. & Cowtan, K. (2007). CCP4 Newsl. 47, contribution 7.
    1. Campbell, J. W. (1995). J. Appl. Cryst. 28, 236–242.
    1. Evans, P. (2006). Acta Cryst. D62, 72–82. - PubMed
    1. Evans, P. R. (2011). Acta Cryst. D67, 282–292. - PMC - PubMed

Publication types

MeSH terms