Performance characteristics of upper airway critical collapsing pressure measurements during sleep
- PMID: 21461324
- PMCID: PMC3065256
- DOI: 10.1093/sleep/34.4.459
Performance characteristics of upper airway critical collapsing pressure measurements during sleep
Abstract
Objective: The critical pressure (P(CRIT)), a measurement of upper airway collapsibility, is a determinant of the severity of upper airway obstruction during sleep. We examined the performance characteristics of the passive and active P(CRIT) by examining both within-night and between-night variability in the measurements.
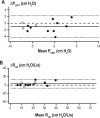
Methods: We studied 54 sleep apnea patients (39 men, 15 women) and 34 normal subjects (20 men, 14 women) on either 1 or 2 nights during sleep. The P(CRIT) was measured during relative hypotonia ("passive" state) or during periods of sustained upper airway obstruction used to recruit upper airway neuromuscular responses ("active" state) within- and between-nights. In a subgroup of 10 normal subjects, we performed repeated measurements during hypnotic-induced sleep. Bland-Altman analyses were used to determine the within-night and between-night reliability of the P(CRIT) measurements.
Results: There were no significant within-night or between-night differences for the mean passive P(CRIT). The active P(CRIT) was ∼1 cm H(2)O more collapsible on the second night than on the first night. The limits of agreement, which bound the passive and active P(CRIT), was ∼ ± 3 cm H(2)O and was reduced to ∼ ± 1 cm H(2)O for the passive P(CRIT) with hypnotic-induced sleep.
Conclusion: Passive and active P(CRIT) measurements are reasonably reliable within and between nights. An approximately 3 cm H(2)O change in passive or active P(CRIT) appears to represent the minimally significant change in P(CRIT) necessary to assess the effect of an intervention (e.g., positional therapy, surgical interventions, oral appliance effects, and pharmacotherapy) on upper airway mechanical loads or neuromuscular responses.
Keywords: Pharyngeal collapsibility; neuromuscular compensation; obstructive sleep apnea; sleep disordered breathing; upper airway mechanics.
Figures


Similar articles
-
Neuromechanical control of upper airway patency during sleep.J Appl Physiol (1985). 2007 Feb;102(2):547-56. doi: 10.1152/japplphysiol.00282.2006. Epub 2006 Sep 28. J Appl Physiol (1985). 2007. PMID: 17008440 Clinical Trial.
-
The effect of gender on compensatory neuromuscular response to upper airway obstruction in normal subjects under midazolam general anesthesia.Anesth Analg. 2009 Oct;109(4):1209-18. doi: 10.1213/ane.0b013e3181b0fc70. Anesth Analg. 2009. PMID: 19762751 Free PMC article. Clinical Trial.
-
Upper airway collapsibility during sleep in upper airway resistance syndrome.Chest. 2002 May;121(5):1531-40. doi: 10.1378/chest.121.5.1531. Chest. 2002. PMID: 12006440
-
Obesity and upper airway control during sleep.J Appl Physiol (1985). 2010 Feb;108(2):430-5. doi: 10.1152/japplphysiol.00919.2009. Epub 2009 Oct 29. J Appl Physiol (1985). 2010. PMID: 19875707 Free PMC article. Review.
-
Assessment of upper airway mechanics during sleep.Respir Physiol Neurobiol. 2008 Nov 30;163(1-3):74-81. doi: 10.1016/j.resp.2008.06.017. Epub 2008 Jun 27. Respir Physiol Neurobiol. 2008. PMID: 18638576 Review.
Cited by
-
Upper airway collapsibility and patterns of flow limitation at constant end-expiratory lung volume.J Appl Physiol (1985). 2012 Sep 1;113(5):691-9. doi: 10.1152/japplphysiol.00091.2012. Epub 2012 May 24. J Appl Physiol (1985). 2012. PMID: 22628372 Free PMC article.
-
A Remote-Controlled Airbag Device Can Improve Upper Airway Collapsibility by Producing Head Elevation With Jaw Closure in Normal Subjects Under Propofol Anesthesia.IEEE J Transl Eng Health Med. 2014 Jul 5;2:2600109. doi: 10.1109/JTEHM.2014.2321062. eCollection 2014. IEEE J Transl Eng Health Med. 2014. PMID: 27170881 Free PMC article.
-
Upper Airway Collapsibility (Pcrit) and Pharyngeal Dilator Muscle Activity are Sleep Stage Dependent.Sleep. 2016 Mar 1;39(3):511-21. doi: 10.5665/sleep.5516. Sleep. 2016. PMID: 26612386 Free PMC article.
-
The relationship between upper airway collapse and the severity of obstructive sleep apnea syndrome: a chart review.J Otolaryngol Head Neck Surg. 2015 Sep 4;44(1):32. doi: 10.1186/s40463-015-0086-2. J Otolaryngol Head Neck Surg. 2015. PMID: 26334998 Free PMC article.
-
Approach for streamlining measurement of complex physiological phenotypes of upper airway collapsibility.Comput Biol Med. 2013 Jun;43(5):600-6. doi: 10.1016/j.compbiomed.2012.12.006. Epub 2013 Mar 18. Comput Biol Med. 2013. PMID: 23517555 Free PMC article.
References
-
- Young T, Peppard PE, Gottlieb DJ. Epidemiology of obstructive sleep apnea: A population health perspective. Am J Respir Crit Care Med. 2002;165:1217–39. - PubMed
-
- Peppard PE, Young T, Palta M, Skatrud J. Prospective study of the association between sleep-disordered breathing and hypertension. N Engl J Med. 2000;342:1378–84. - PubMed
-
- Nieto FJ, Young TB, Lind BK, et al. Association of sleep-disordered breathing, sleep apnea, and hypertension in a large community-based study. Sleep Heart Health Study. JAMA. 2000;283:1829–36. - PubMed
-
- Punjabi NM, Sorkin JD, Katzel LI, Goldberg AP, Schwartz AR, Smith PL. Sleep-disordered breathing and insulin resistance in middle-aged and overweight men. Am J Respir Crit Care Med. 2002;165:677–82. - PubMed
-
- Shahar E, Whitney CW, Redline S, et al. Sleep-disordered breathing and cardiovascular disease: cross-sectional results of the Sleep Heart Health Study. Am J Respir Crit Care Med. 2001;163:19–25. - PubMed
Publication types
MeSH terms
Grants and funding
LinkOut - more resources
Full Text Sources

