

Effects of socioeconomic factors on obesity rates in four southern states and Colorado
- PMID: 21462731
- PMCID: PMC3101796
Effects of socioeconomic factors on obesity rates in four southern states and Colorado
Abstract
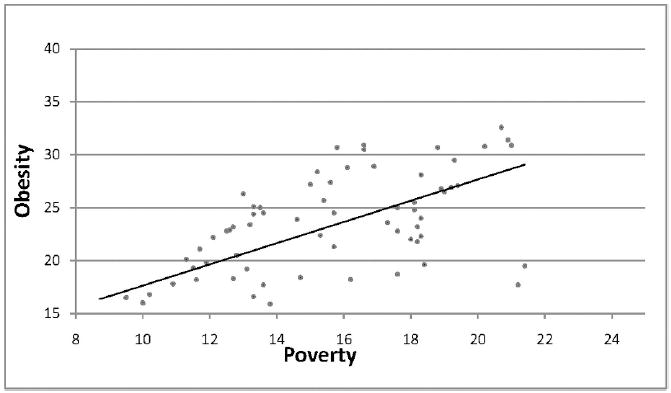
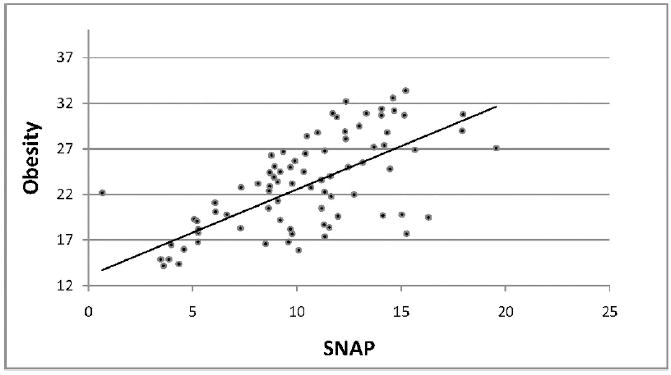
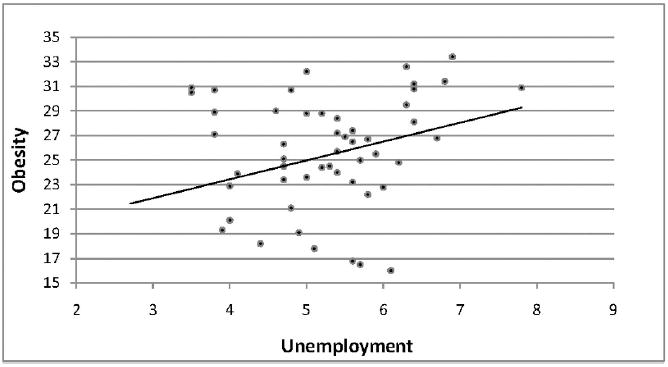
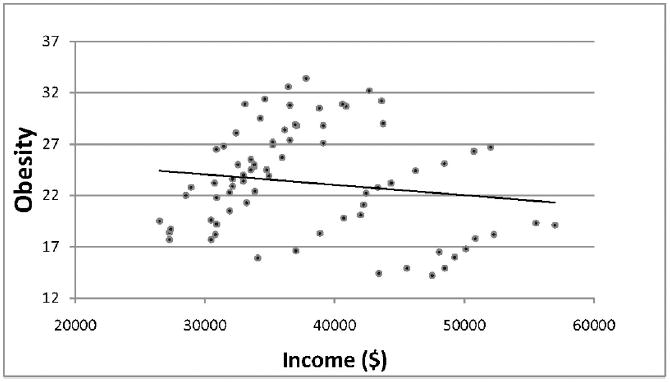
Objective: To examine the association between the increase in body mass index (BMI) and socioeconomic factors (eg, income level, % below poverty line, unemployment rates and persons receiving food stamps) in Mississippi, Alabama, Louisiana, Tennessee and Colorado.
Design: Data from Behavioral Risk Factor Surveillance System, United States Department of Agriculture and the United States Department of Labor/Bureau of Labor were obtained and analyzed for the years 1995-2008.
Results: Results from this study showed a strong association between obesity and the tested variables (R2 = .767). Factors more closely related with obesity were: income below poverty level; receipt of food stamps; unemployment; and general income level. The coefficient of determination for these variables were 0.438, 0.427, 0.103 and 0.018, respectively. The highest rate of obesity was found in Mississippi (26.5% +/- 4.13%) followed by Alabama (25.18% +/- 4.41%), while Colorado had the lowest rate of obesity (15.4% +/- 2.63%). By ethnicity, African Americans had the highest rate of obesity (32.64 +/- 5.99%).
Conclusion: We found a significant effect of consumption of low-quality food, due to economic factors, on increased BMI. Besides physical activity, the quality and the quantity of food are important factors that contribute to obesity rates.
Figures
References
-
- Centers for Disease Control and Prevention. [October 3, 2009];Overweight and Obesity. Available at: www.cdc.gov/obesity.
-
- Wang Y, Beydoun MA. The obesity epidemic in the United States—gender, age, socioeconomic, racial/ethnic, and geographic characteristics: a systematic review and meta-regression analysis. Epidemiol Rev. 2007;29:6–28. - PubMed
-
- Klein S, Allison DB, Heymsfield SB, et al. Waist circumference and cardiometabolic risk: a consensus statement from Shaping America’s Health: Association for Weight Management and Obesity Prevention; NAASO, The Obesity Society; the American Society for Nutrition; and the American Diabetes Association. Am J Clin Nutr. 2007;85:1197–1202. - PubMed
Publication types
MeSH terms
Grants and funding
LinkOut - more resources
Full Text Sources
Medical