

A systems biology representation of developmental anatomy
- PMID: 21463299
- PMCID: PMC3125892
- DOI: 10.1111/j.1469-7580.2011.01371.x
A systems biology representation of developmental anatomy
Abstract
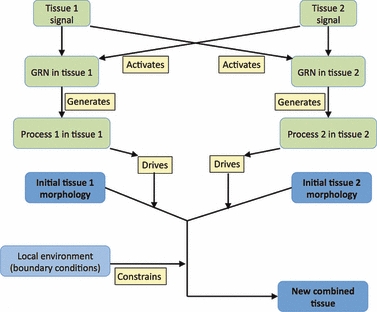
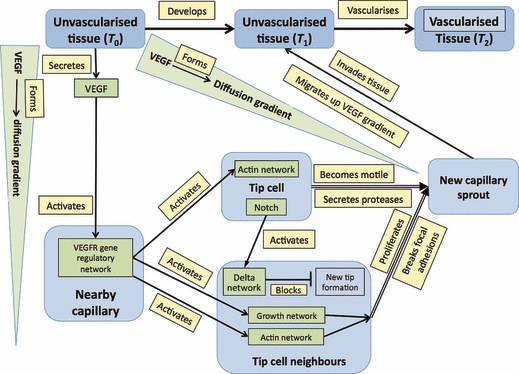
The formation of any tissue involves differentiation, cell dynamics and interactions with adjacent tissues. This paper suggests that the complexity of the system as a whole can be represented as a mathematical graph, that is, a set of connected triples of the general form [term] <relationship> [term]. Computationally, such graphs are widely used for modeling data; visually, they form hierarchies and networks. For morphogenesis, the triples are of the general structure <noun > <verb > <noun >, where nouns cover tissues, molecules and networks and verbs describe processes such as moves, differentiates, grows and apoptoses. The paper considers the general formalism of graphs, where graphs are already used in biology, and how developmental anatomy may be described using this format. Representing morphogenesis as a visual graph is complicated as the formalism has to incorporate tissue types, molecular signals, networks, dynamic processes and some aspects, at least, of tissue geometry. The formation of a capillary sprout is chosen as an example of how this complexity can be represented graphically, with colour used to distinguish tissues and molecules. There are three key benefits, beyond its compactness, in using the graph formalism of morphogenesis to complement experimentation. First, it emphasizes the distributed nature of causality in morphogenesis. Secondly, producing all the triples for the visual graph requires explicit formalization of each aspect of the process, and this, in turn, often exposes gaps in knowledge and so suggests new experiments. Thirdly, once the graph has been formalized, triples can be annotated with associated information or IDs (e.g. cell types, publications, gene-expression data) that link to external online resources that may be regularly updated. Such annotations allow the graph to be viewed as a self-maintaining review. The graph approach sees dynamic processes as the drivers of developmental momentum and, because the same processes are used many times during development, it seems appropriate to view them as modules and their underlying networks as genomic subroutines.
© 2011 The Author. Journal of Anatomy © 2011 Anatomical Society of Great Britain and Ireland.
Figures


References
-
- Alon U. An Introduction to Systems Biology. Boca Raton: Chapman & Hall/CRC; 2007.
-
- Bard JBL. A model generating aspects of zebra and other mammalian coat patterns. J Theor Biol. 1981;93:363–385. - PubMed
-
- Bard J. Morphogenesis: the Cellular and Molecular Processes of Developmental Anatomy. 2nd edn. Cambridge: Cambridge University Press; 1992.
-
- Bard JBL, Ross ASA. The morphogenesis of the ciliary body of the avian eye. II: Differential enlargement causes an epithelium to buckle. Dev Biol. 1982;92:87–96. - PubMed
-
- Davies JA. Mechanisms of Morphogenesis. San Diego: Elsevier Academic Press; 2005.
MeSH terms
LinkOut - more resources
Full Text Sources
