. 2011 Apr 6;100(7):1617-26.
doi: 10.1016/j.bpj.2011.02.014.

Long signaling cascades tend to attenuate retroactivity

Affiliations

Long signaling cascades tend to attenuate retroactivity

Hamid R Ossareh et al. Biophys J. .

Abstract

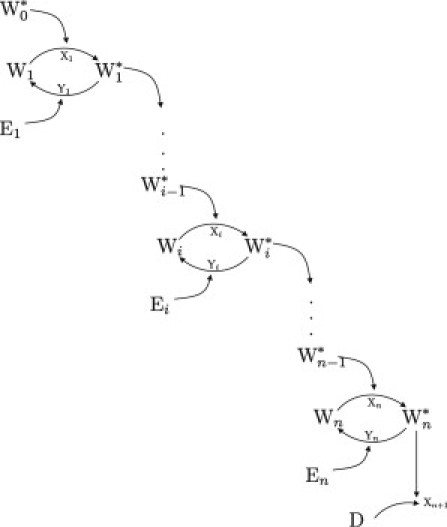
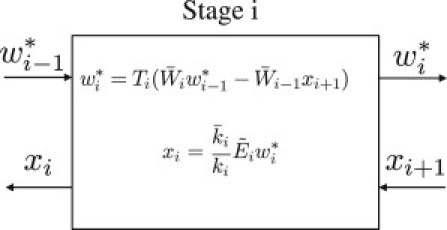
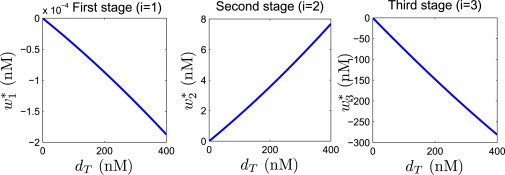
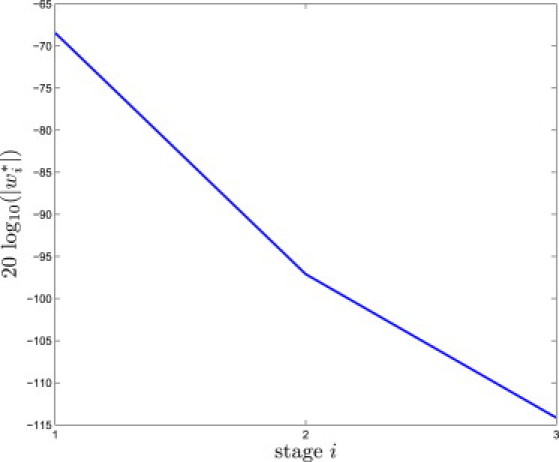
Signaling pathways consisting of phosphorylation/dephosphorylation cycles with no explicit feedback allow signals to propagate not only from upstream to downstream but also from downstream to upstream due to retroactivity at the interconnection between phosphorylation/dephosphorylation cycles. However, the extent to which a downstream perturbation can propagate upstream in a signaling cascade and the parameters that affect this propagation are presently unknown. Here, we determine the downstream-to-upstream steady-state gain at each stage of the signaling cascade as a function of the cascade parameters. This gain can be made smaller than 1 (attenuation) by sufficiently fast kinase rates compared to the phosphatase rates and/or by sufficiently large Michaelis-Menten constants and sufficiently low amounts of total stage protein. Numerical studies performed on sets of biologically relevant parameters indicated that ∼50% of these parameters could give rise to amplification of the downstream perturbation at some stage in a three-stage cascade. In an n-stage cascade, the percentage of parameters that lead to an overall attenuation from the last stage to the first stage monotonically increases with the cascade length n and reaches 100% for cascades of length at least 6.


Figures

Figure 1
Figure 1
A signaling cascade with n stages of PD cycles. The phosphorylated protein Wi–1 of stage i–1 functions as a kinase for protein Wi of the next stage downstream. Dephosphorylation is brought about by the phosphatase Ei. A downstream perturbation in the concentration of D, in which D can be a substrate shared with other signaling pathways or an inhibitor of the active enzyme Wn, results in a perturbation of protein concentration in all upstream stages.
Figure 2
Figure 2
A block diagram representation of the steady-state response of stage i to a small downstream perturbation in DT. The downstream perturbation propagates upstream through perturbations xi in the complexes of active proteins with their downstream substrates.
Figure 3
Figure 3
Attenuation and sign-reversal in a three-stage cascade. The x axis shows the value of the perturbation dT and the y axis shows the steady-state value of the resulting perturbations w1, w2, and w3. Simulation is performed on the full nonlinear ODE model given by Eq. 2. The parameters of each stage i are taken from Huang and Ferrell (28) and are given by ki = 150 (min)−1, k¯i=150(min)1, αi = 2.5 (nM min)−1, a¯i=600(min)1, bi = 2.5 (nM min)−1, b¯i=600(min)1, E3T = 120 nM, E2T = 0.3 nM, E1T = 0.3 nM, W3T = 1200 nM, W2T = 1200 nM, W1T = 3 nM, W¯0=0.3nM, and D¯T=0nM. As a result, Ki = 300 nM and K¯i=300nM.
Figure 4
Figure 4
Amplification in a three-stage cascade. Numerical simulation of system in Eq. 2: value of |wi| for i ∈{1,…,n} in response to a unit perturbation dT = 1. This plot shows that violation of the necessary condition leads to amplification of the downstream perturbation as it transfers upstream in the cascade. Parameters of stage i are given by: ki = 150 (min)−1, k¯i=150(min)1, ai = 2500 (nM min)−1, a¯i=600(min)1, bi = 2500 (nM min)−1, b¯i=600(min)1, E3T = 120 nM, E2T = 30 nM, E1T = 0.3 nM, W3T = 3 nM, W2T = 30 nM, W1T = 1200 nM, W¯0=0.3nM, and D¯T=0.9nM.
Figure 5
Figure 5
Percentage of simulations with overall attenuation (Ψtot < 1) as a function of the number of stages in a cascade with parameters randomly selected from the intervals of Table 1.

References

    1. Alberts B., Bray D., Watson J.D. Garland; New York: 2002. The Molecular Biology of the Cell.
    1. Lauffenburger D.A. Cell signaling pathways as control modules: complexity for simplicity? Proc. Natl. Acad. Sci. USA. 2000;97:5031–5033. - PMC - PubMed
    1. Fell D. Portland Press; London, UK: 1997. Understanding the Control of Metabolism.
    1. Seger R., Krebs E.G. The MAPK signaling cascade. FASEB J. 1995;9:726–735. - PubMed
    1. Rubinfeld H., Seger R. The ERK cascade: a prototype of MAPK signaling. Mol. Biotechnol. 2005;31:151–174. - PubMed

Publication types

LinkOut - more resources