

Microsecond simulations indicate that ethanol binds between subunits and could stabilize an open-state model of a glycine receptor
- PMID: 21463577
- PMCID: PMC3072665
- DOI: 10.1016/j.bpj.2011.02.032
Microsecond simulations indicate that ethanol binds between subunits and could stabilize an open-state model of a glycine receptor
Abstract
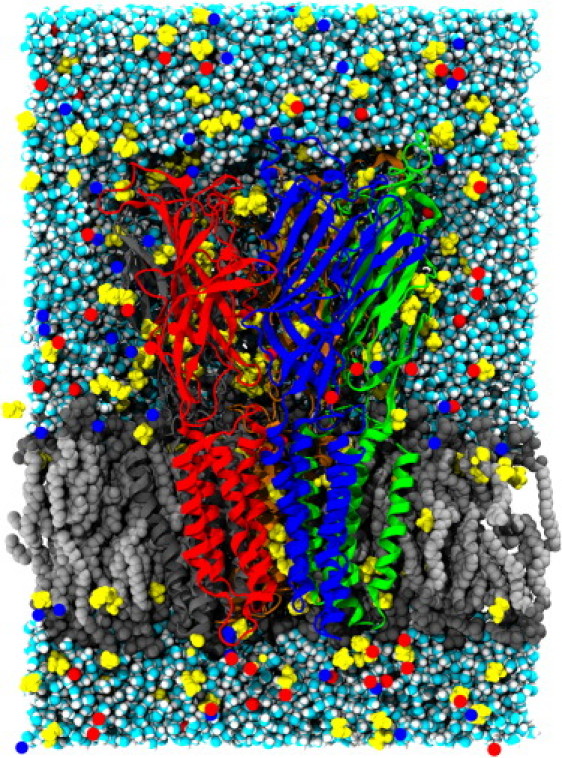
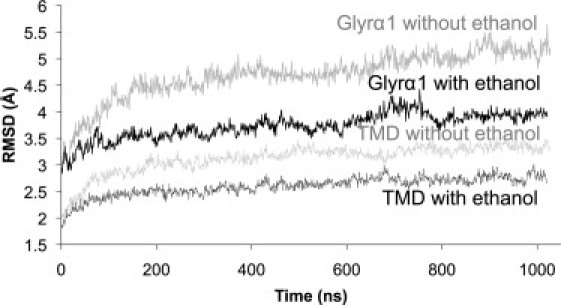
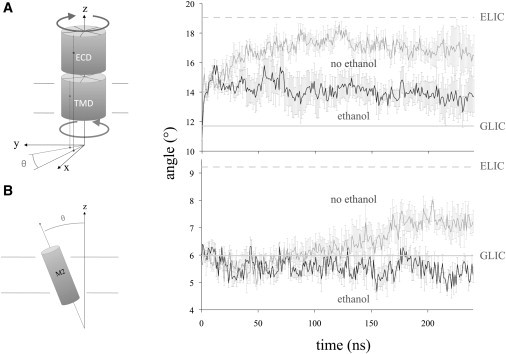
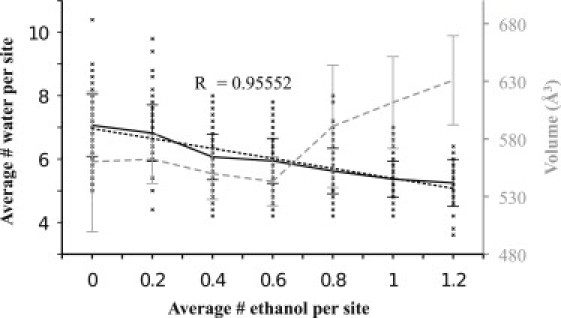
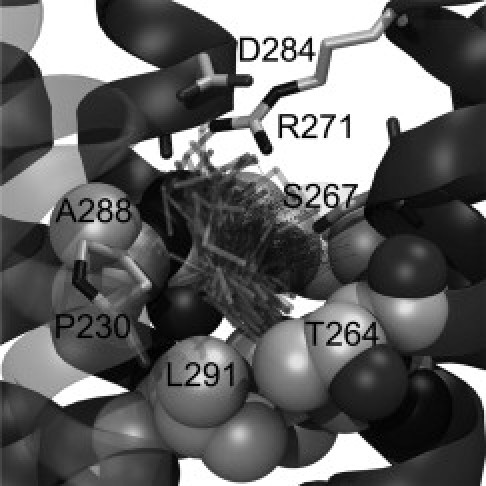
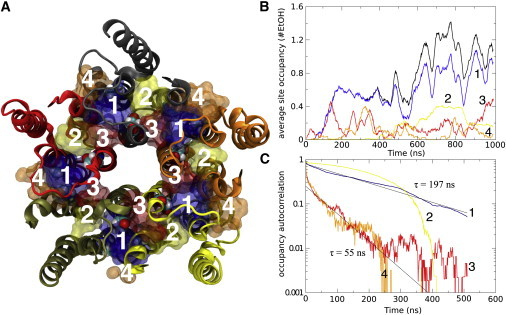
Cys-loop receptors constitute a superfamily of ion channels gated by ligands such as acetylcholine, serotonin, glycine, and γ-aminobutyric acid. All of these receptors are thought to share structural characteristics, but due to high sequence variation and limited structure availability, our knowledge about allosteric binding sites is still limited. These sites are frequent targets of anesthetic and alcohol molecules, and are of high pharmacological importance. We used molecular simulations to study ethanol binding and equilibrium exchange for the homomeric α1 glycine receptor (GlyRα1), modeled on the structure of the Gloeobacter violaceus pentameric ligand-gated channel. Ethanol has a well-known potentiating effect and can be used in high concentrations. By performing two microsecond-scale simulations of GlyR with/without ethanol, we were able to observe spontaneous binding in cavities and equilibrium ligand exchange. Of interest, it appears that there are ethanol-binding sites both between and within the GlyR transmembrane subunits, with the intersubunit site having the highest occupancy and slowest exchange (∼200 ns). This model site involves several residues that were previously identified via mutations as being crucial for potentiation. Finally, ethanol appears to stabilize the GlyR model built on a presumably open form of the ligand-gated channel. This stabilization could help explain the effects of allosteric ligand binding in Cys-loop receptors.
Copyright © 2011 Biophysical Society. Published by Elsevier Inc. All rights reserved.
Figures
Similar articles
-
Molecular dynamics simulations of ethanol binding to the transmembrane domain of the glycine receptor: implications for the channel potentiation mechanism.Proteins. 2008 May 1;71(2):972-81. doi: 10.1002/prot.21784. Proteins. 2008. PMID: 18004757
-
Loop 2 structure in glycine and GABA(A) receptors plays a key role in determining ethanol sensitivity.J Biol Chem. 2009 Oct 2;284(40):27304-14. doi: 10.1074/jbc.M109.023598. Epub 2009 Aug 5. J Biol Chem. 2009. PMID: 19656948 Free PMC article.
-
Molecular mechanism for the dual alcohol modulation of Cys-loop receptors.PLoS Comput Biol. 2012;8(10):e1002710. doi: 10.1371/journal.pcbi.1002710. Epub 2012 Oct 4. PLoS Comput Biol. 2012. PMID: 23055913 Free PMC article.
-
Structure and Pharmacologic Modulation of Inhibitory Glycine Receptors.Mol Pharmacol. 2016 Sep;90(3):318-25. doi: 10.1124/mol.116.105726. Epub 2016 Jul 11. Mol Pharmacol. 2016. PMID: 27401877 Free PMC article. Review.
-
The Cys-loop superfamily of ligand-gated ion channels: the impact of receptor structure on function.Biochem Soc Trans. 2004 Jun;32(Pt3):529-34. doi: 10.1042/BST0320529. Biochem Soc Trans. 2004. PMID: 15157178 Review.
Cited by
-
Menthol Binding to the Human α4β2 Nicotinic Acetylcholine Receptor Facilitated by Its Strong Partitioning in the Membrane.J Phys Chem B. 2020 Mar 12;124(10):1866-1880. doi: 10.1021/acs.jpcb.9b10092. Epub 2020 Mar 2. J Phys Chem B. 2020. PMID: 32048843 Free PMC article.
-
Exploring volatile general anesthetic binding to a closed membrane-bound bacterial voltage-gated sodium channel via computation.PLoS Comput Biol. 2013;9(6):e1003090. doi: 10.1371/journal.pcbi.1003090. Epub 2013 Jun 13. PLoS Comput Biol. 2013. PMID: 23785267 Free PMC article.
-
Stabilization of the GluCl ligand-gated ion channel in the presence and absence of ivermectin.Biophys J. 2013 Aug 6;105(3):640-7. doi: 10.1016/j.bpj.2013.06.037. Biophys J. 2013. PMID: 23931312 Free PMC article.
-
Structural models of ligand-gated ion channels: sites of action for anesthetics and ethanol.Alcohol Clin Exp Res. 2014 Mar;38(3):595-603. doi: 10.1111/acer.12283. Epub 2013 Oct 24. Alcohol Clin Exp Res. 2014. PMID: 24164436 Free PMC article. Review.
-
Effect of ethanol on Munc13-1 C1 in Membrane: A Molecular Dynamics Simulation Study.Alcohol Clin Exp Res. 2020 Jul;44(7):1344-1355. doi: 10.1111/acer.14363. Epub 2020 Jun 18. Alcohol Clin Exp Res. 2020. PMID: 32424866 Free PMC article.
References
-
- Brejc K., van Dijk W.J., Sixma T.K. Crystal structure of an ACh-binding protein reveals the ligand-binding domain of nicotinic receptors. Nature. 2001;411:269–276. - PubMed
-
- Unwin N. Refined structure of the nicotinic acetylcholine receptor at 4A resolution. J. Mol. Biol. 2005;346:967–989. - PubMed
-
- Hilf R.J., Dutzler R. A prokaryotic perspective on pentameric ligand-gated ion channel structure. Curr. Opin. Struct. Biol. 2009;19:418–424. - PubMed
-
- Celentano J.J., Gibbs T.T., Farb D.H. Ethanol potentiates GABA- and glycine-induced chloride currents in chick spinal cord neurons. Brain Res. 1988;455:377–380. - PubMed
-
- Ye Q., Koltchine V.V., Harris R.A. Enhancement of glycine receptor function by ethanol is inversely correlated with molecular volume at position α267. J. Biol. Chem. 1998;273:3314–3319. - PubMed
Publication types
MeSH terms
Substances
Grants and funding
LinkOut - more resources
Full Text Sources
Other Literature Sources
Miscellaneous
