

Cell protrusions and tethers: a unified approach
- PMID: 21463583
- PMCID: PMC3072668
- DOI: 10.1016/j.bpj.2011.02.038
Cell protrusions and tethers: a unified approach
Abstract
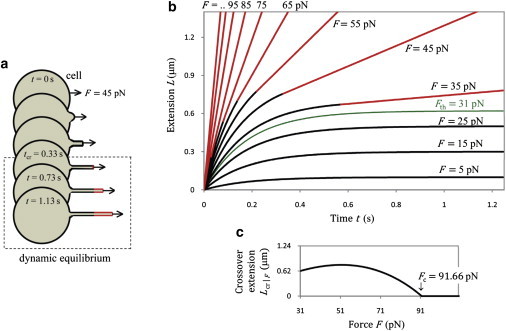
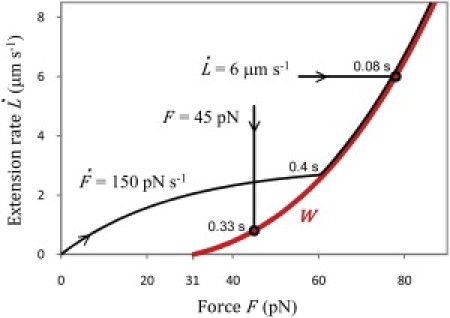
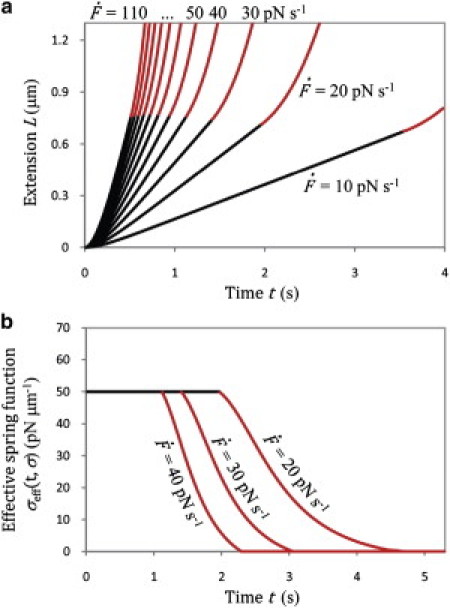
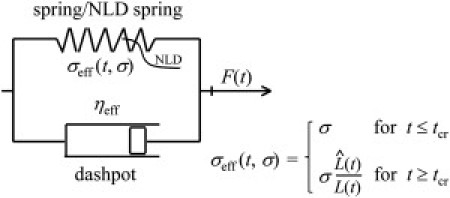
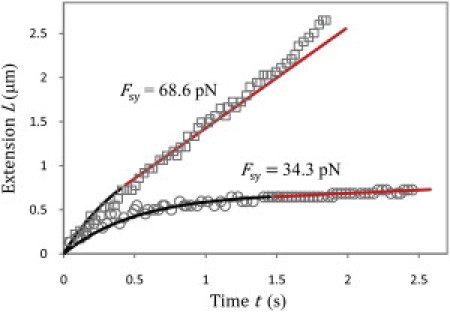
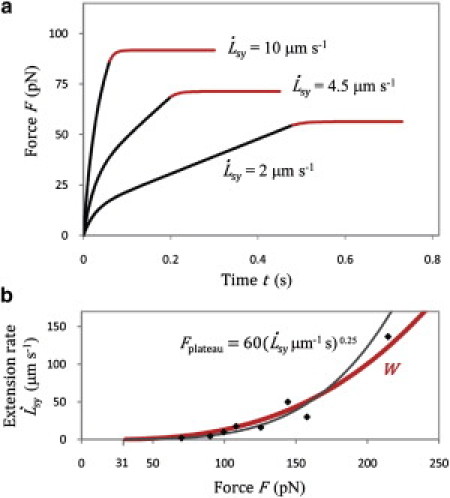
Low pulling forces applied locally to cell surface membranes produce viscoelastic cell surface protrusions. As the force increases, the membrane can locally separate from the cytoskeleton and a tether forms. Tethers can grow to great lengths exceeding the cell diameter. The protrusion-to-tether transition is known as the crossover. Here we propose a unified approach to protrusions and tethers providing, to our knowledge, new insights into their biomechanics. We derive a necessary and sufficient condition for a crossover to occur, a formula for predicting the crossover time, conditions for a tether to establish a dynamic equilibrium (characterized by constant nonzero pulling force and tether extension rate), a general formula for the tether material after crossover, and a general modeling method for tether pulling experiments. We introduce two general protrusion parameters, the spring constant and effective viscosity, valid before and after crossover. Their first estimates for neutrophils are 50 pN μm(-1) and 9 pN s μm(-1), respectively. The tether elongation after crossover is described as elongation of a viscoelastic-like material with a nonlinearly decaying spring (NLDs-viscoelastic material). Our model correctly describes the results of the published protrusion and tether pulling experiments, suggesting that it is universally applicable to such experiments.
Copyright © 2011 Biophysical Society. Published by Elsevier Inc. All rights reserved.
Figures
Similar articles
-
Biomechanics of Neutrophil Tethers.Life (Basel). 2021 May 31;11(6):515. doi: 10.3390/life11060515. Life (Basel). 2021. PMID: 34073130 Free PMC article. Review.
-
Visco-elastic membrane tethers extracted from Escherichia coli by optical tweezers.Biophys J. 2007 Dec 1;93(11):4068-75. doi: 10.1529/biophysj.107.103861. Epub 2007 Aug 17. Biophys J. 2007. PMID: 17704145 Free PMC article.
-
Effect of temperature on tether extraction, surface protrusion, and cortical tension of human neutrophils.Biophys J. 2007 Oct 15;93(8):2923-33. doi: 10.1529/biophysj.107.105346. Epub 2007 Jun 22. Biophys J. 2007. PMID: 17586566 Free PMC article.
-
Endothelial Surface Protrusion by a Point Force.Biophys J. 2016 Mar 8;110(5):1150-7. doi: 10.1016/j.bpj.2016.01.007. Biophys J. 2016. PMID: 26958891 Free PMC article.
-
Cell membrane biophysics with optical tweezers.Eur Biophys J. 2018 Jul;47(5):499-514. doi: 10.1007/s00249-017-1268-9. Epub 2017 Nov 21. Eur Biophys J. 2018. PMID: 29164289 Review.
Cited by
-
Molecular structure of membrane tethers.Biophys J. 2012 Apr 18;102(8):1866-71. doi: 10.1016/j.bpj.2012.03.048. Biophys J. 2012. PMID: 22768942 Free PMC article.
-
'Slings' enable neutrophil rolling at high shear.Nature. 2012 Aug 16;488(7411):399-403. doi: 10.1038/nature11248. Nature. 2012. PMID: 22763437 Free PMC article.
-
Yielding elastic tethers stabilize robust cell adhesion.PLoS Comput Biol. 2014 Dec 4;10(12):e1003971. doi: 10.1371/journal.pcbi.1003971. eCollection 2014 Dec. PLoS Comput Biol. 2014. PMID: 25473833 Free PMC article.
-
Biomechanics of Neutrophil Tethers.Life (Basel). 2021 May 31;11(6):515. doi: 10.3390/life11060515. Life (Basel). 2021. PMID: 34073130 Free PMC article. Review.
-
Effector and Regulatory T Cells Roll at High Shear Stress by Inducible Tether and Sling Formation.Cell Rep. 2017 Dec 26;21(13):3885-3899. doi: 10.1016/j.celrep.2017.11.099. Cell Rep. 2017. PMID: 29281835 Free PMC article.
References
Publication types
MeSH terms
Grants and funding
LinkOut - more resources
Full Text Sources
Research Materials
