. 2011 Apr 6;100(7):1737-46.
doi: 10.1016/j.bpj.2011.02.028.

Regulatory light chain phosphorylation and N-terminal extension increase cross-bridge binding and power output in Drosophila at in vivo myofilament lattice spacing

Affiliations

Regulatory light chain phosphorylation and N-terminal extension increase cross-bridge binding and power output in Drosophila at in vivo myofilament lattice spacing

Mark S Miller et al. Biophys J. .

Abstract

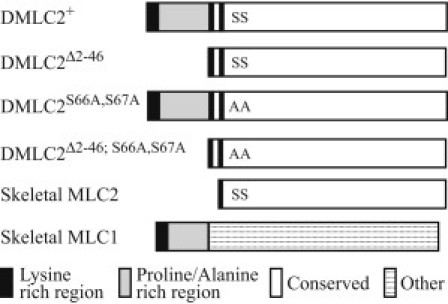
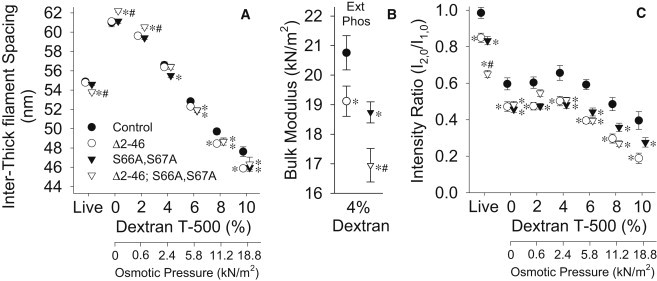
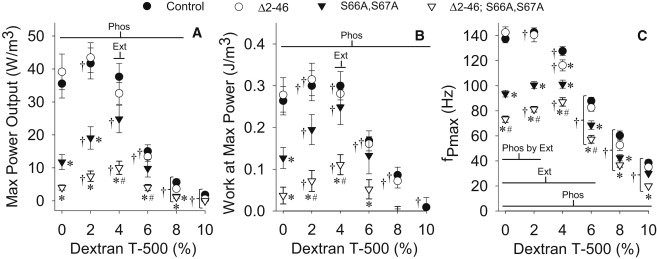
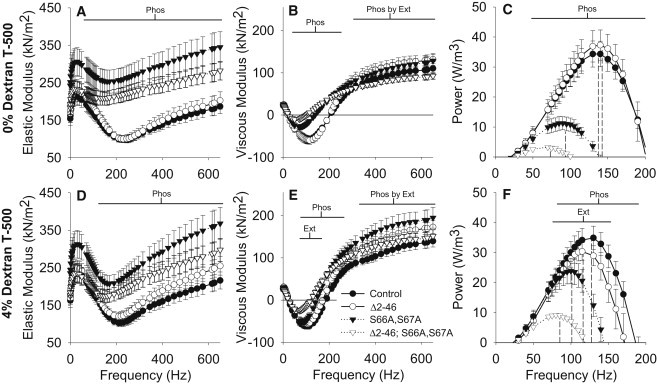
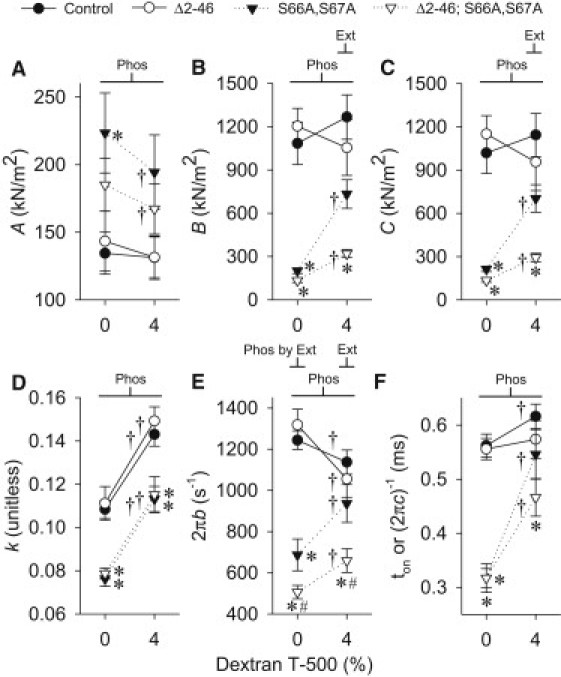
The N-terminal extension and phosphorylation of the myosin regulatory light chain (RLC) independently improve Drosophila melanogaster flight performance. Here we examine the functional and structural role of the RLC in chemically skinned fibers at various thick and thin filament lattice spacings from four transgenic Drosophila lines: rescued null or control (Dmlc2(+)), truncated N-terminal extension (Dmlc2(Δ2-46)), disrupted myosin light chain kinase phosphorylation sites (Dmlc2(S66A,S67A)), and dual mutant (Dmlc2(Δ2-46; S66A,S67A)). The N-terminal extension truncation and phosphorylation sites disruption mutations decreased oscillatory power output and the frequency of maximum power output in maximally Ca(2+)-activated fibers compressed to near in vivo inter-thick filament spacing, with the phosphorylation sites disruption mutation having a larger affect. The diminished power output parameters with the N-terminal extension truncation and phosphorylation sites disruption mutations were due to the reduction of the number of strongly-bound cross-bridges and rate of myosin force production, with the larger parameter reductions in the phosphorylation sites disruption mutation additionally related to reduced myosin attachment time. The phosphorylation and N-terminal extension-dependent boost in cross-bridge kinetics corroborates previous structural data, which indicate these RLC attributes play a complementary role in moving and orienting myosin heads toward actin target sites, thereby increasing fiber and whole fly power generation.


Figures

Figure 1
Figure 1
Schematic representation comparing the MLC2 sequences of Drosophila IFM (DMLC2) to MLC1 and MLC2 sequences of vertebrate skeletal muscle. Note that DLMC2Δ2-46 is similar to skeletal MLC2 and that the DMLC2+ N-terminal extension is similar to the skeletal MLC1 N-terminal extension. All representations are aligned with N-terminus to the left and C-terminus to the right. + = control; Δ2-46 = truncated N-terminal extension; S66A,S67A = disrupted phosphorylation sites and Δ2-46; S66A,S67A = truncated N-terminal extension and disrupted phosphorylation sites. S = serine, A = alanine.
Figure 2
Figure 2
Inter-thick filament spacing (A) and intensity ratio, or I2,0/I1,0 (C) of IFM from resting, live flies and relaxed fibers compressed with dextran T-500 (% w/v) for RLC mutants and control. Note that some symbols are hidden (e.g., control at 2% dextran) behind overlapping measurements. Bulk modulus (B), or compressive elastic modulus, calculated at 4% dextran T-500 from the relationship between inter-thick filament spacing and osmotic compression for relaxed fibers. Within dextran concentration: asterisk () indicates a significant difference from control; pound sign (#) indicates a significant difference from Δ2-46 and S66A,S67A; and Ext and Phos indicate significant differences between N-terminal extension length (normal versus truncated) and phosphorylation sites state (normal versus disrupted), respectively. Fibers examined: Δ2-46 = 15; S66A,S67A = 15; Δ2-46; S66A,S67A = 10; and control = 12.
Figure 3
Figure 3
Maximum power output (A), work at maximum power output (B), and frequency of maximum power output (C) for active IFM fibers compressed with dextran T-500 (% w/v) for RLC mutants and control. Within dextran concentration: asterisk () indicates a significant difference from control; pound sign (#) indicates a significant difference from Δ2-46 and S66A,S67A; and Ext, Phos, and Phos by Ext indicate a significant difference between N-terminal extension length (normal versus truncated), between phosphorylation sites state (normal versus disrupted), and a significant interaction, respectively. Between dextran concentrations: dagger symbol (†) indicates a significant difference from the 0% dextran T-500 value. Fibers examined: Δ2-46 = 8; S66A,S67A = 8; Δ2-46; S66A,S67A = 16; and control = 19.
Figure 4
Figure 4
Elastic modulus (A and D), viscous modulus (B and E), and power output (C and F) from active IFM fibers across fiber oscillation frequencies for skinned (0% w/v dextran T-500, AC) and near in vivo inter-thick filament spacing (4% dextran T-500, DF) for RLC mutants and control. (Dashed lines in C and F) The fPmax (frequency of maximum power output) from Fig. 3. Ext, Phos, and Phos by Ext indicate a significant difference between N-terminal extension length (normal versus truncated), between phosphorylation sites state (normal versus disrupted), and a significant interaction, respectively. Fibers examined: Δ2-46 = 8; S66A,S67A = 8; Δ2-46; S66A,S67A = 16; and control = 19.
Figure 5
Figure 5
Dependence of fitted parameters A, B, C, k, 2πb, and ton (AF, respectively) from active IFM fibers on osmotic compression from skinned (0% w/v dextran T-500) to near in vivo inter-thick filament spacing (4% dextran T-500) for RLC mutants and control. Within dextran concentration: the asterisk symbol () indicates a significant difference from control; the pound symbol (#) indicates a significant difference from Δ2-46 and S66A,S67A; and Ext, Phos, and Phos by Ext indicate a significant difference between N-terminal extension lengths (normal versus truncated), between phosphorylation sites state (normal versus disrupted) and a significant interaction, respectively. Between dextran concentrations: dagger symbol (†) indicates a significant difference between the 0% and 4% dextran T-500 value. Fibers examined: Δ2-46 = 8; S66A,S67A = 8; Δ2-46; S66A,S67A = 12; and control = 19.

Similar articles

Cited by

References

    1. Trybus K.M., Lowey S. Conformational states of smooth muscle myosin. Effects of light chain phosphorylation and ionic strength. J. Biol. Chem. 1984;259:8564–8571. - PubMed
    1. Sweeney H.L., Bowman B.F., Stull J.T. Myosin light chain phosphorylation in vertebrate striated muscle: regulation and function. Am. J. Physiol. 1993;264:C1085–C1095. - PubMed
    1. Levine R.J., Kensler R.W., Sweeney H.L. Myosin light chain phosphorylation affects the structure of rabbit skeletal muscle thick filaments. Biophys. J. 1996;71:898–907. - PMC - PubMed
    1. Colson B.A., Locher M.R., Moss R.L. Differential roles of regulatory light chain and myosin binding protein-C phosphorylations in the modulation of cardiac force development. J. Physiol. 2010;588:981–993. - PMC - PubMed
    1. Szczesna D., Zhao J., Potter J.D. Phosphorylation of the regulatory light chains of myosin affects Ca2+ sensitivity of skeletal muscle contraction. J. Appl. Physiol. 2002;92:1661–1670. - PubMed

Publication types

Substances