

Surface-sensitive Raman spectroscopy of collagen I fibrils
- PMID: 21463598
- PMCID: PMC3072603
- DOI: 10.1016/j.bpj.2011.02.026
Surface-sensitive Raman spectroscopy of collagen I fibrils
Abstract
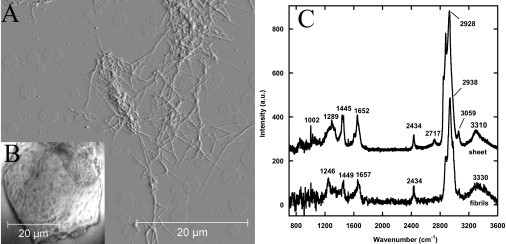
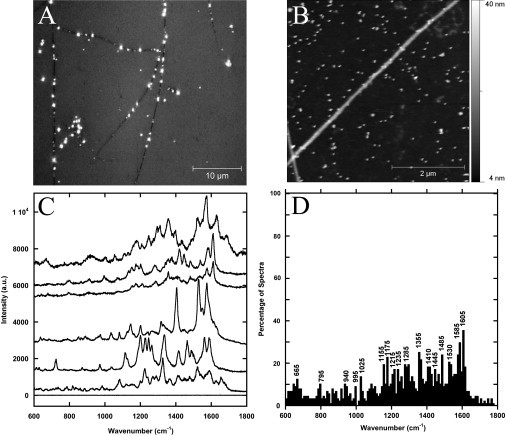
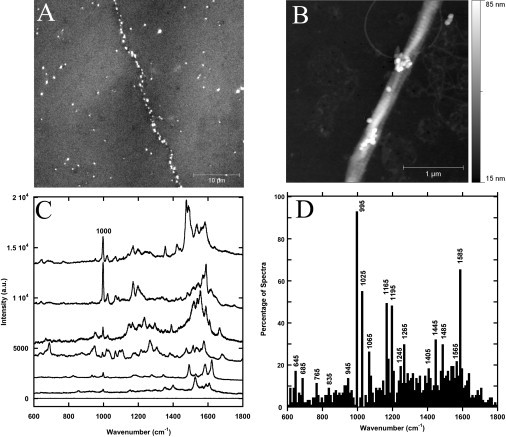
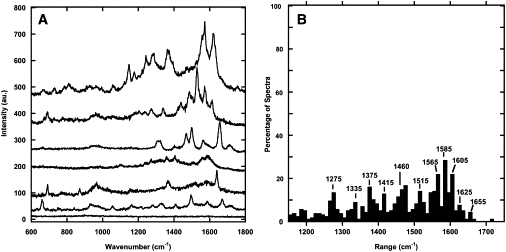
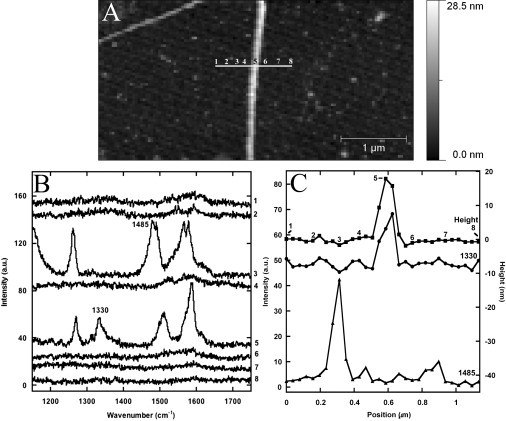
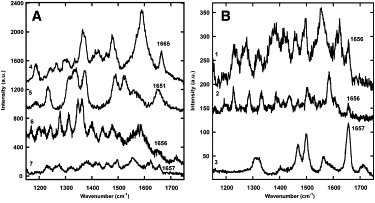
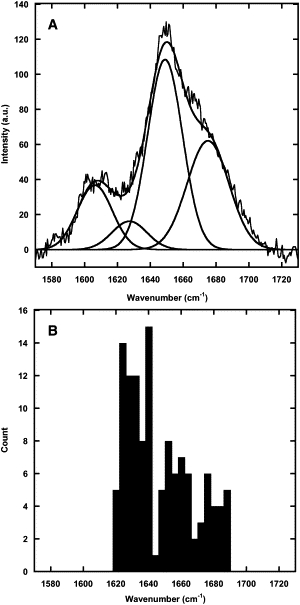
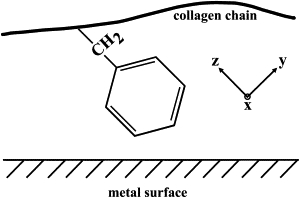
Collagen fibrils are the main constituent of the extracellular matrix surrounding eukaryotic cells. Although the assembly and structure of collagen fibrils is well characterized, very little appears to be known about one of the key determinants of their biological function-namely, the physico-chemical properties of their surface. One way to obtain surface-sensitive structural and chemical data is to take advantage of the near-field nature of surface- and tip-enhanced Raman spectroscopy. Using Ag and Au nanoparticles bound to Collagen type-I fibrils, as well as tips coated with a thin layer of Ag, we obtained Raman spectra characteristic to the first layer of collagen molecules at the surface of the fibrils. The most frequent Raman peaks were attributed to aromatic residues such as phenylalanine and tyrosine. In several instances, we also observed Amide I bands with a full width at half-maximum of 10-30 cm(-1). The assignment of these Amide I band positions suggests the presence of 3(10)-helices as well as α- and β-sheets at the fibril's surface.
Copyright © 2011 Biophysical Society. Published by Elsevier Inc. All rights reserved.
Figures
Similar articles
-
Intense Raman scattering on hybrid Au/Ag nanoplatforms for the distinction of MMP-9-digested collagen type-I fiber detection.Biosens Bioelectron. 2015 Oct 15;72:61-70. doi: 10.1016/j.bios.2015.04.091. Epub 2015 Apr 29. Biosens Bioelectron. 2015. PMID: 25957832
-
Fabrication, characterization, and application in surface-enhanced Raman spectrum of assembled type-I collagen-silver nanoparticle multilayered films.J Chem Phys. 2008 Feb 21;128(7):074704. doi: 10.1063/1.2832322. J Chem Phys. 2008. PMID: 18298161
-
Unraveling capillary interaction and viscoelastic response in atomic force microscopy of hydrated collagen fibrils.Nanoscale. 2017 Jan 19;9(3):1244-1256. doi: 10.1039/c6nr07697a. Nanoscale. 2017. PMID: 28054696
-
Surface-enhanced Raman scattering in local optical fields of silver and gold nanoaggregates-from single-molecule Raman spectroscopy to ultrasensitive probing in live cells.Acc Chem Res. 2006 Jul;39(7):443-50. doi: 10.1021/ar050107x. Acc Chem Res. 2006. PMID: 16846208 Review.
-
Fabrication of surface-enhanced Raman spectroscopy substrates using silver nanoparticles produced by laser ablation in liquids.Spectrochim Acta A Mol Biomol Spectrosc. 2023 Aug 5;296:122694. doi: 10.1016/j.saa.2023.122694. Epub 2023 Apr 5. Spectrochim Acta A Mol Biomol Spectrosc. 2023. PMID: 37030254 Review.
Cited by
-
Ammonia Toxicity and Associated Protein Oxidation: A Single-Cell Surface Enhanced Raman Spectroscopy Study.Chem Res Toxicol. 2024 Jan 15;37(1):117-125. doi: 10.1021/acs.chemrestox.3c00368. Epub 2023 Dec 26. Chem Res Toxicol. 2024. PMID: 38146714 Free PMC article.
-
Collagen organization and structure in FLBN5-/- mice using label-free microscopy: implications for pelvic organ prolapse.bioRxiv [Preprint]. 2024 Feb 1:2024.01.31.578106. doi: 10.1101/2024.01.31.578106. bioRxiv. 2024. Update in: Biomed Opt Express. 2024 Apr 05;15(5):2863-2875. doi: 10.1364/BOE.518976. PMID: 38352586 Free PMC article. Updated. Preprint.
-
Infrared and Raman chemical imaging and spectroscopy at the nanoscale.Chem Soc Rev. 2020 Jun 7;49(11):3315-3347. doi: 10.1039/c8cs00916c. Epub 2020 May 19. Chem Soc Rev. 2020. PMID: 32424384 Free PMC article.
-
μ-FTIR, μ-Raman, and SERS Analysis of Amide I Spectral Region in Oral Biofluid Samples during Orthodontic Treatment.Sensors (Basel). 2022 Oct 17;22(20):7874. doi: 10.3390/s22207874. Sensors (Basel). 2022. PMID: 36298224 Free PMC article.
-
Spatially resolved spectroscopic differentiation of hydrophilic and hydrophobic domains on individual insulin amyloid fibrils.Sci Rep. 2016 Sep 21;6:33575. doi: 10.1038/srep33575. Sci Rep. 2016. PMID: 27650589 Free PMC article.
References
-
- Bonifacio A., Sergo V. Effects of sample orientation in Raman microspectroscopy of collagen fibers and their impact on the interpretation of the Amide III band. Vib. Spectrosc. 2010;53:314–317.
-
- Heino J., Huhtala M., Johnson M.S. Evolution of collagen-based adhesion systems. Int. J. Biochem. Cell Biol. 2009;41:341–348. - PubMed
-
- Myllyharju J. Intracellular post-translational modifications of collagens. Top. Curr. Chem. 2005;247:115–147.
-
- Dominguez L.J., Barbagallo M., Moro L. Collagen overglycosylation: a biochemical feature that may contribute to bone quality. Biochem. Biophys. Res. Commun. 2005;330:1–4. - PubMed
Publication types
MeSH terms
Substances
LinkOut - more resources
Full Text Sources
