Review
. 2011 Sep;279(1-2):140-8.
doi: 10.1016/j.heares.2011.03.015. Epub 2011 Apr 2.

Developmental plasticity of auditory cortical inhibitory synapses

Affiliations
Review

Developmental plasticity of auditory cortical inhibitory synapses

Dan H Sanes et al. Hear Res. 2011 Sep.

Abstract

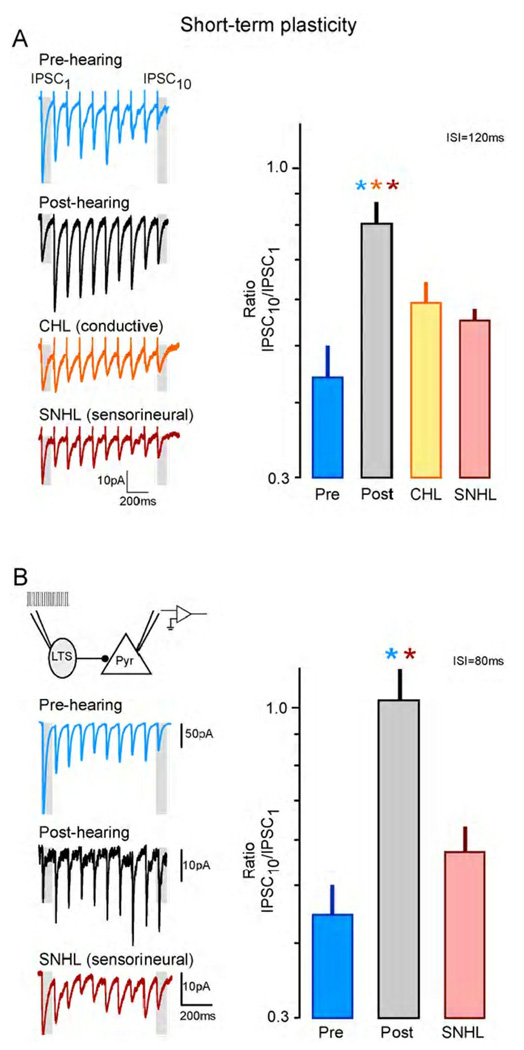
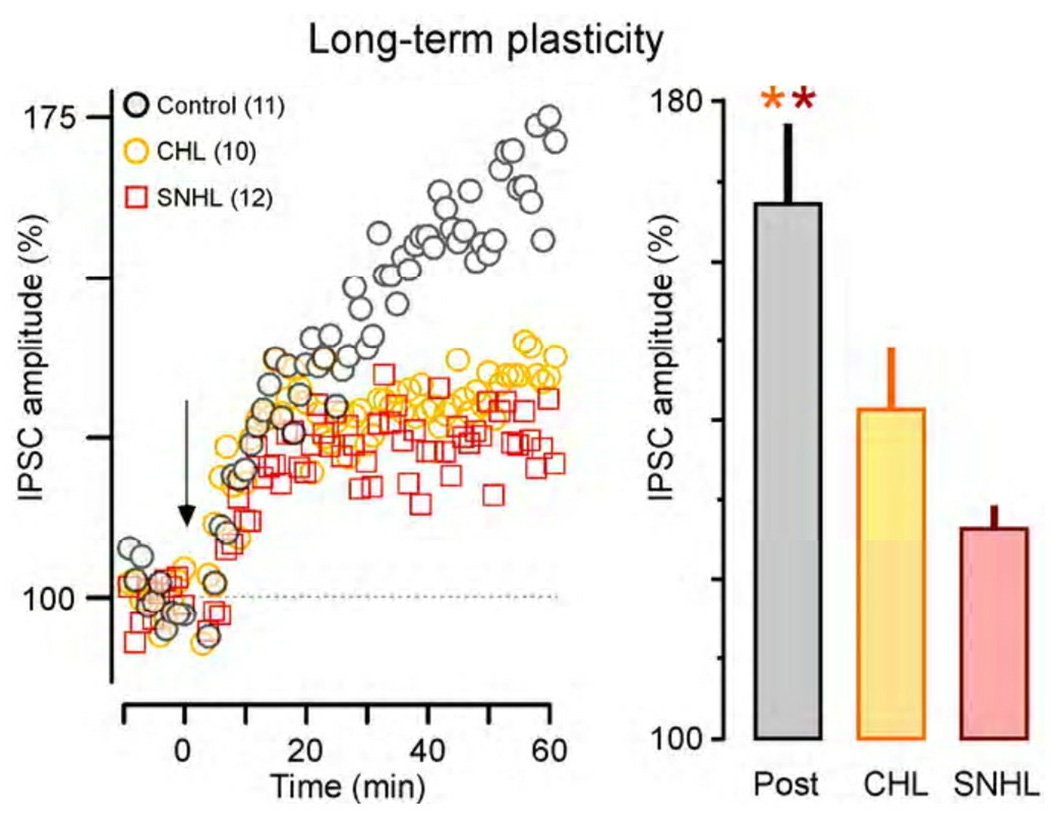
Functional inhibitory synapses form in auditory cortex well before the onset of normal hearing. However, their properties change dramatically during normal development, and many of these maturational events are delayed by hearing loss. Here, we review recent findings on the developmental plasticity of inhibitory synapse strength, kinetics, and GABAA receptor localization in auditory cortex. Although hearing loss generally leads to a reduction of inhibitory strength, this depends on the type of presynaptic interneuron. Furthermore, plasticity of inhibitory synapses also depends on the postsynaptic target. Hearing loss leads reduced GABAA receptor localization to the membrane of excitatory, but not inhibitory neurons. A reduction in normal activity in development can also affect the use-dependent plasticity of inhibitory synapses. Even moderate hearing loss can disrupt inhibitory short- and long-term synaptic plasticity. Thus, the cortex did not compensate for the loss of inhibition in the brainstem, but rather exacerbated the response to hearing loss by further reducing inhibitory drive. Together, these results demonstrate that inhibitory synapses are exceptionally dynamic during development, and deafness-induced perturbation of inhibitory properties may have a profound impact on auditory processing.


Figures

Figure 1
Figure 1
Experimental preparation. A perihorizontal brain slice (right), contains the medial geniculate (MG) projection to auditory cortex (ACx). Whole cell voltage clamp recordings are obtained from supragranular pyramidal (P) neurons, and spontaneous inhibitory postsynaptic currents, or evoked currents (stimulating electrode) are acquired. In other experiments, supragranular interneurons are recorded spike-elicited IPSCs are recorded in the pyramidal neuron. Fast-spiking (FS) and low-threshold spiking (LTS) interneurons are identified based on soma shape visualized under IR-DIC, and by their discharge pattern in response to direct current injection into the cell body via the recording eletrode.
Figure 2
Figure 2
The development and plasticity of FS- and LTS-evoked inhibitory currents. (A) Paired recordings are obtained from fast-spiking (FS) interneurons and Pyramidal cells (P), and evoked IPSCs are measured (top). The bar graph illustrates the significant increase in FS-evoked IPSCs from pre- to post-hearing (asterisk, t-test, p<0.01). However, this change does not occur following developmental sensorineural hearing loss (HL) (p<0.01). Representative IPSCs are shown above each bar. (B) Paired recordings are obtained from low threshold-spiking (LTS) interneurons and Pyramidal cells (P), and evoked IPSCs are measured (top). The bar graph illustrates the significant decline in LTS-evoked IPSCs from pre- to post-hearing (asterisk, t-test, p<0.001). However, this change does not occur following HL (p<0.05). Representative IPSCs are shown above each bar. Note the difference between the y-axis scale (arrows). Number of recordings are shown within each bar. Adapted from Takesian et al., 2010.
Figure 3
Figure 3
Development and plasticity of inhibitory synaptic kinetics. (A) The duration of sIPSCs are plotted as histograms for 3 individual neurons from pre-hearing, post-hearing, and hearing loss animals (left). A normal fit of each distribution is shown on the histogram. The summary bar graph shows the average (±SEM) duration of sIPSCs recorded in each of the 3 groups, with representative sIPSCs above each bar (right). The sIPSC duration declines significantly from pre- to post-hearing, but this does not occur following developmental sensorineural hearing loss (HL). (B) The change in sIPSC duration in response to a β2/3-specific agent (loreclezole) is shown for neurons in each of the 3 groups (left). Filled bars indicate sIPSC duration before drug, and open bars indicate the duration after drug application. Only post-hearing neurons displayed a loreclezole-dependent increase in sIPSC duration (asterisk). A similar result is obtained for an α1-specific agent (zolpidem) (right). Adapted from Kotak et al., 2008.
Figure 4
Figure 4
Sensorineural hearing loss-induced changes to the localization of GABAA receptors and GAD in ACx. (A) Electron micrograph of GABAA β2/3 immunolabeling on the plasma membrane, as revealed by the SIG procedure (top). In this example from control tissue, a cluster of SIG particles (white asterisk) appears at the junction between 2 plasma membranes forming a symmetric synapse between an axon terminal (At) and a soma (S). A nearby asymmetric synapse, presumed to be excitatory, is unlabeled (arrow). The histogram (bottom), illustrates that the percentage of membranous β2/3 subunits was significantly lower (asterisk) on pyramidal neuron somata following hearing loss (HL), but this change did not occur at interneurons. (B) Electron micrograph of GAD65/67 immunolabeling, as revealed by the SIG procedure (top). In this example from HL tissue, SIG particles (white asterisk) are found within inhibitory axon profiles forming symmetric synapses, presumed to be inhibitory, onto adjacent somata (S). White arrow denotes the active zone. The histogram (bottom), illustrates that the density of GAD was significantly higher in axons targeting pyramidal neuron somata (asterisk) following hearing loss (HL), but this change did not occur at interneuronal somata. Scale bars are 500 nm. Adapted from Sarro et al., 2008.
Figure 5
Figure 5
Both conductive (CHL) and sensorineural (SNHL) hearing loss disrupt inhibitory short-term plasticity. (A) Representative recordings obtained from pyramidal neurons in response to brief trains of stimuli delivered locally (left), show that normal pre-hearing neurons display short-term depression which is reduced in post-hearing neurons. However, the short-term depression remains following developmental CHL or SNHL. The bar graph (right) plots the ratio of the 10th to the 1st IPSC in the train (highlighted with gray bars in each example trace), as a measure of short-term depression. There is a significant increase in synaptic depression (i.e., reduction in the ratio) for neurons from animals with either form of developmental hearing loss. The interstimulus interval for this data is 120ms. (B) Representative responses from paired LTS-pyramidal cell recordings in pre-hearing, post-hearing, and SNHL neurons (left). The bar graph (right) plots the ratio of the 10th to the 1st IPSC in the train (highlighted with gray bars in each example trace), as a measure of short-term depression. There is a significant decrease of inhibitory short-term depression (i.e., increase in the ratio) at LTS synapses during normal development (pre- to post-hearing), but this change is not observed following developmental SNHL. The interstimulus interval for this data is 80ms. Adapted from Takesian et al., 2010.
Figure 6
Figure 6
Both conductive (CHL) and sensorineural (SNHL) hearing loss disrupt inhibitory long-term plasticity in the ACx. Recordings were obtained from layers 2/3 pyramidal neurons in response to stimuli delivered in layer 4, and the change in IPSC amplitude was monitored over 70 mins (left). Following a series of conditioning stimuli (arrow), control neurons from post-hearing animals displayed long-term potentiation (black circles). In contrast, neurons from CHL and SNHL animals displayed less potentiation. The bar graph (right) plots the final percent increase in IPSC amplitude recorded at 50–60 mins post conditioning, and shows that there was significantly less potentiation for both forms of developmental hearing loss (asterisks). Adapted from Xu et al., 2010.

Similar articles

Cited by

References

    1. Abraham WC, Bear MF. Metaplasticity: the plasticity of synaptic plasticity. Trends Neurosci. 1996;19:126–130. - PubMed
    1. Abidin I, Eysel UT, Lessmann V, Mittmann T. Impaired GABAergic inhibition in the visual cortex of brain-derived neurotrophic factor heterozygous knockout mice. J Physiol. 2008;586:1885–1901. - PMC - PubMed
    1. Atencio CA, Schreiner CE. Spectrotemporal processing differences between auditory cortical fast-spiking and regular-spiking neurons. J Neurosci. 2008;28:3897–3910. - PMC - PubMed
    1. Bacon SP, Gleitman RM. Modulation detection in subjects with relatively flat hearing losses. J Speech Hear Res. 1992;35:642–653. - PubMed
    1. Banks MI, Hardie JB, Pearce RA. Development of GABA(A) receptor-mediated inhibitory postsynaptic currents in hippocampus. J Neurophysiol. 2002;88:3097–3107. - PubMed

Publication types

Substances