

Fine particulate matter constituents associated with cardiovascular hospitalizations and mortality in New York City
- PMID: 21463978
- PMCID: PMC3080927
- DOI: 10.1289/ehp.1002667
Fine particulate matter constituents associated with cardiovascular hospitalizations and mortality in New York City
Abstract
Background: Recent time-series studies have indicated that both cardiovascular disease (CVD)mortality and hospitalizations are associated with particulate matter (PM). However, seasonal patterns of PM associations with these outcomes are not consistent, and PM components responsible for these associations have not been determined. We investigated this issue in New York City (NYC), where PM originates from regional and local combustion sources.
Objective: In this study, we examined the role of particulate matter with aerodynamic diameter ≤ 2.5 µm (PM(2.5)) and its key chemical components on both CVD hospitalizations and on mortality in NYC.
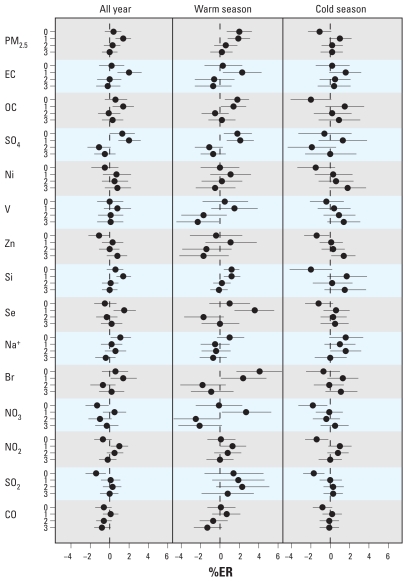
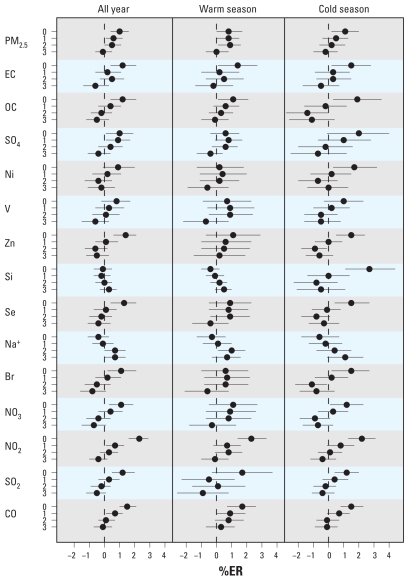
Methods: We analyzed daily deaths and emergency hospitalizations for CVDs among persons ≥ 40 years of age for associations with PM(2.5), its chemical components, nitrogen dioxide (NO(2)), carbon monoxide, and sulfur dioxide for the years 2000-2006 using a Poisson time-series model adjusting for temporal and seasonal trends, temperature effects, and day of the week. We estimated excess risks per interquartile-range increases at lags 0 through 3 days for warm (April through September) and cold (October through March) seasons.
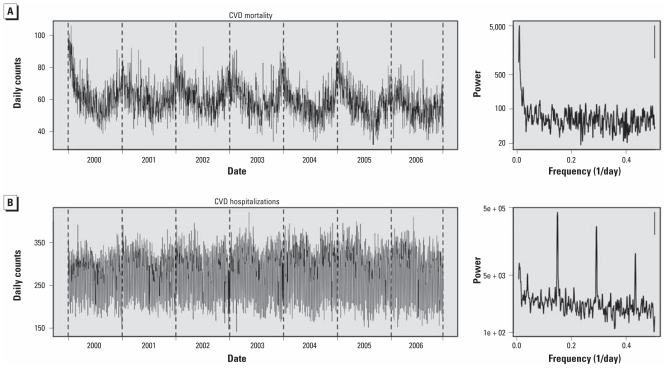
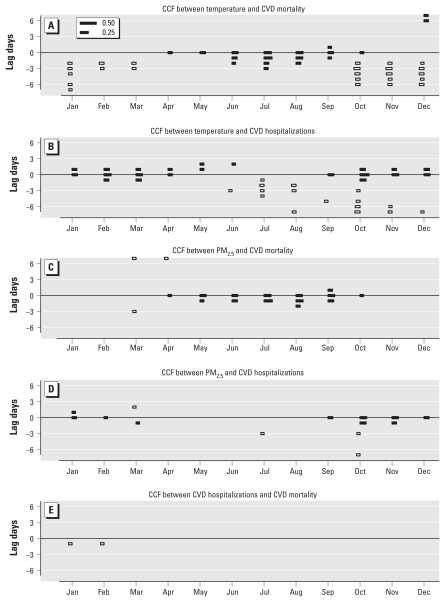
Results: The CVD mortality series exhibit strong seasonal trends, whereas the CVD hospitalization series show a strong day-of-week pattern. These outcome series were not correlated with each other but were individually associated with a number of PM(2.5) chemical components from regional and local sources, each with different seasonal patterns and lags. Coal-combustion-related components (e.g., selenium) were associated with CVD mortality in summer and CVD hospitalizations in winter, whereas elemental carbon and NO(2) showed associations with these outcomes in both seasons.
Conclusion: Local combustion sources, including traffic and residual oil burning, may play a year-round role in the associations between air pollution and CVD outcomes, but transported aerosols may explain the seasonal variation in associations shown by PM(2.5) mass.
Figures
References
-
- Brook RD, Rajagopalan S, Pope CA, III, Brook JR, Bhatnagar A, Diez-Roux AV, et al. Particulate matter air pollution and cardiovascular disease: an update to the scientific statement from the American Heart Association. Circulation. 2010;121((21)):2331–2378. - PubMed
-
- Curriero FC, Heiner KS, Samet JM, Zeger SL, Strug L, Patz JA. Temperature and mortality in 11 cities of the eastern United States. Am J Epidemiol. 2002;155((1)):80–87. - PubMed
Publication types
MeSH terms
Substances
Grants and funding
LinkOut - more resources
Full Text Sources
Medical
Miscellaneous