. 2011 Jun 1;71(11):3963-71.
doi: 10.1158/0008-5472.CAN-10-0906. Epub 2011 Apr 4.

Convection-enhanced delivery of topotecan into a PDGF-driven model of glioblastoma prolongs survival and ablates both tumor-initiating cells and recruited glial progenitors

Affiliations

Convection-enhanced delivery of topotecan into a PDGF-driven model of glioblastoma prolongs survival and ablates both tumor-initiating cells and recruited glial progenitors

Kim A Lopez et al. Cancer Res. .

Abstract

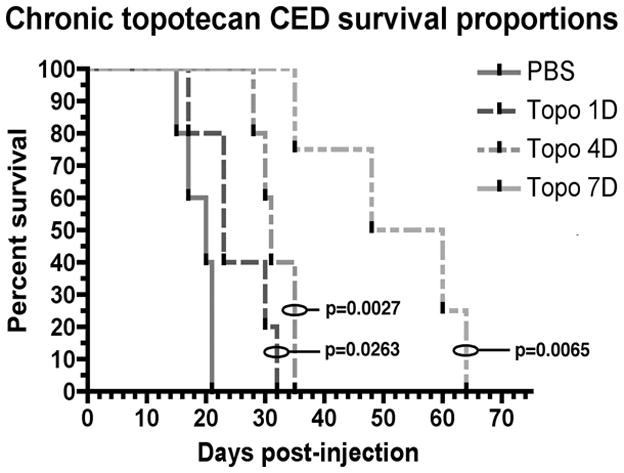
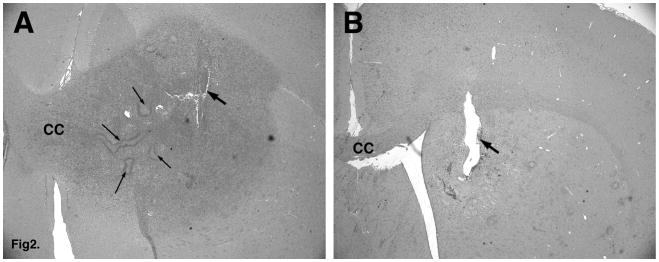
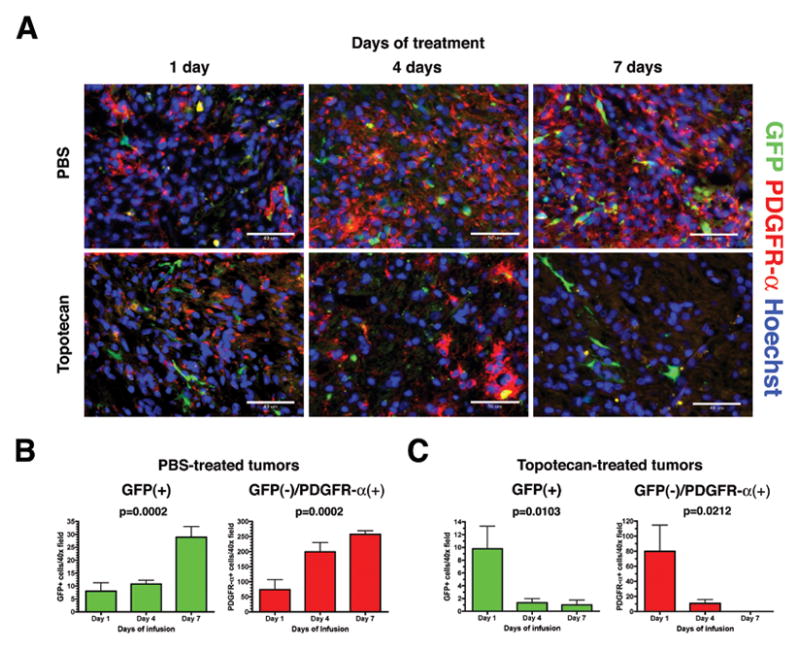
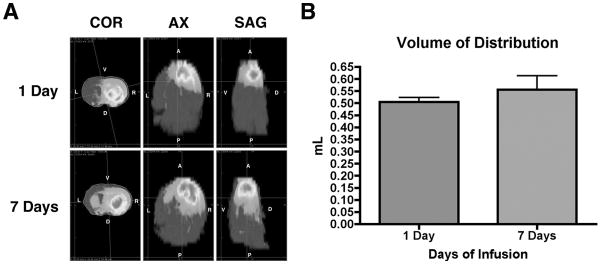
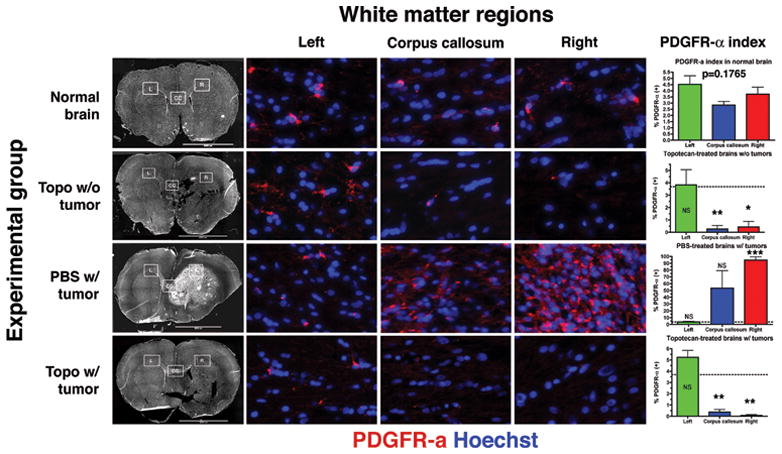
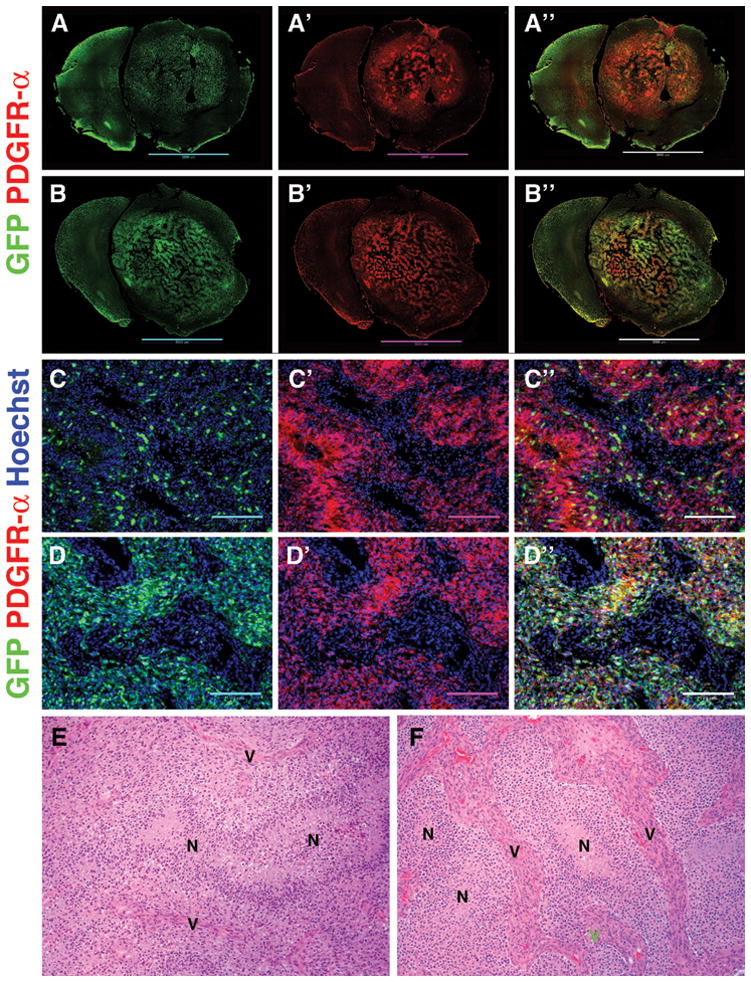
The contribution of microenvironment to tumor growth has important implications for optimizing chemotherapeutic response and understanding the biology of recurrent tumors. In this study, we tested the effects of locally administered topotecan on a rat model of glioblastoma that is induced by intracerebral injection of PDGF (platelet-derived growth factor)-IRES (internal ribosome entry site)-GFP (green fluorescent protein)-expressing retrovirus, treated the tumors by convection-enhanced delivery (CED) of topotecan (136 μmol/L) for 1, 4, or 7 days, and then characterized the effects on both the retrovirus-transformed tumor cells (GFP(+) cells) as well as the uninfected glial progenitor cells (GFP(-) cells) that are recruited to the tumor. Topotecan treatment reduced GFP(+) cells about 10-fold and recruited progenitors by about 80-fold while providing a significant survival advantage that improved with greater treatment duration. Regions of glial progenitor ablation occurred corresponding to the anatomic distribution of topotecan as predicted by MRI of a surrogate tracer. Histopathologic changes in recurrent tumors point to a decrease in recruitment, most likely due to the chemotherapeutic ablation of the recruitable progenitor pool.


Conflict of interest statement

There are no conflicts of interest to disclose.

Figures

Figure 1
Figure 1. Chronic CED of topotecan provides significant survival advantage
Median survival of PBS-treated animals was 20 dpi. Animals that received 1 day of topotecan CED had a median of survival of 23 dpi. Animals that received 4 days of treatment had a median survival of 31 dpi. Animals that received 7 days of treatment had a median survival of 54 dpi. P-values shown are for comparisons of each curve to the control (log-rank test). Each treatment curve was also statistically different from every other treatment curve (p<0.05).
Figure 2
Figure 2. Seven-day CED of topotecan causes loss of identifiable tumor cells
A. PDGF retroviral tumor after 7-day CED of PBS. Note the large proliferative lesion with cells invading through the corpus callosum (CC). Thick arrow points to the injection/cannula site. Thin arrows point to areas of pseudopalisading necrosis. B. Topotecan-treated brain (7 days post-treatment) shows the absence of any identifiable tumor cells.
Figure 3
Figure 3. CED of topotecan causes loss of both tumor-initiating cells and recruited glial progenitors
A. Immunohistochemistry for GFP (green) and PDGFR-α (red) shows an increase in both the initially infected PDGF-expressing cells (GFP+) as well as the recruited progenitors (GFP-/PDGFR-α+) over 1, 4, and 7 days when animals are given CED of PBS (upper row). CED of topotecan causes a similarly time-dependent decrease in cells from both populations (lower row). Hoechst nuclear counterstain in blue. B. Increase in GFP+ and GFP-/PDGFR-α+ cells per HPF over time in PBS-treated tumors was statistically significant on one-way ANOVA and also positive for test of linear trend (p=0.0002 and p=0.0002, respectively). C. Decrease in GFP+ and GFP-/PDGFR-α+ cells per HPF over time in topotecan-treated tumors was statistically significant on one-way ANOVA and also positive for test of linear trend (p=0.0103 and p=0.0212, respectively). Fields were taken at 400× magnification (scale bar= 50 μm).
Figure 4
Figure 4. Vd of gadodiamide/topotecan CED at 1 day was statistically similar to Vd at 7 days
A. Heat maps of hyperintense gadolinium signal on T1-weighted MRIs show the anatomic distribution of infusate at 1 day vs. 7 days post-infusion in 3 planes (COR=coronal, AX=axial, SAG=sagittal). At 1 day, the ipsilateral (right) frontal lobe is completely infiltrated with infusate. At 7 days, infusate has extended posteriorly into the ipsilateral parietal lobe and also across the corpus callosum into the contralateral striatum. B. There was a slight increase in mean Vd between 1-day vs. 7-day post-infusion (0.5044±0.0186 mL vs. 0.5566±0.0576 mL respectively) but this was not statistically significant (p=0.4455).
Figure 5
Figure 5. Loco-regional ablation of PDGFR-α+ glial progenitors coincides with anatomic distribution of gadodiamide/topotecan infusate
Immunohistochemistry for PDGFR-α (red) and Hoechst counterstain (blue) was done in 3 different anatomic regions of the white matter (inset boxes on whole brain montages in the first column from left; L=left, CC=corpus callosum, R=right). Rows correspond to different experimental groups. Columns 2 to 3 correspond to white matter regions as labeled. High-power images taken at ~800× magnification. Last column shows graphical representation of mean ± SEM PDGFR-α labeling indices. t-tests were performed comparing means from each region in each experimental group with the corresponding region in normal brain. NS=not significant, *p<0.05, **p<0.01, ***p<0.001. Dotted line represents mean PDGFR-α labeling index of all regions of normal white matter in aggregate (3.69%; not statistically different on one-way ANOVA, p=0.1765).
Figure 6
Figure 6. Recurrent tumors are composed of a higher proportion of tumor-initiating GFP+ cells
A–A″. Color-separated triptych shows distribution of GFP+ cells (green) in control PBS-treated tumors. The majority of tumor cells are PDGFR-α+ (red) but GFP-. B–B″. Tumors that recurred after topotecan CED (7 days) have a higher proportion of GFP+ cells than naïve tumors. The majority of cells are still PDGFR-α+. C–C″. Color-separated triptych of a naïve tumor showing the distribution and relative abundance of GFP+ cells (100× magnification, scale bar 200 mm). D–D″. Color-separated triptych of a recurrent tumor post-topotecan CED shows increased abundance of GFP+ cells. Hoechst nuclear counterstain in blue. E. H&E stains of a naïve tumor showing vascular proliferation (V) and areas of pseudopalisading necrosis (N). F. H&E stains of a recurrent tumor post-topotecan CED showing similar areas of necrosis (N) but larger tumor vessels (V).

Similar articles

Cited by

References

    1. Dawson MR, Polito A, Levine JM, Reynolds R. NG2-expressing glial progenitor cells: an abundant and widespread population of cycling cells in the adult rat CNS. Mol Cell Neurosci. 2003;24:476–488. - PubMed
    1. Horner PJ, Thallmair M, Gage FH. Defining the NG2-expressing cell of the adult CNS. J Neurocytol. 2002;31:469–480. - PubMed
    1. Rhee W, Ray S, Yokoo H, Hoane ME, Lee CC, Mikheev AM, Horner PJ, Rostomily RC. Quantitative analysis of mitotic Olig2 cells in adult human brain and gliomas: implications for glioma histogenesis and biology. Glia. 2009;57:510–523. - PMC - PubMed
    1. Roy NS, Wang S, Harrison-Restelli C, Benraiss A, Fraser RA, Gravel M, Braun PE, Goldman SA. Identification, isolation, and promoter-defined separation of mitotic oligodendrocyte progenitor cells from the adult human subcortical white matter. J Neurosci. 1999;19:9986–9995. - PMC - PubMed
    1. Alonso G. NG2 proteoglycan-expressing cells of the adult rat brain: possible involvement in the formation of glial scar astrocytes following stab wound. Glia. 2005;49:318–338. - PubMed

Publication types

MeSH terms