. 2011 Apr 19;123(15):1633-41.
doi: 10.1161/CIRCULATIONAHA.110.008185. Epub 2011 Apr 4.

Nkx2-5 represses Gata1 gene expression and modulates the cellular fate of cardiac progenitors during embryogenesis

Affiliations

Nkx2-5 represses Gata1 gene expression and modulates the cellular fate of cardiac progenitors during embryogenesis

Arianna Caprioli et al. Circulation. .

Abstract

Background: Recent studies suggest that the hematopoietic and cardiac lineages have close ontogenic origins, and that an early mesodermal cell population has the potential to differentiate into both lineages. Studies also suggest that specification of these lineages is inversely regulated. However, the transcriptional networks that govern the cell fate specification of these progenitors are incompletely defined.

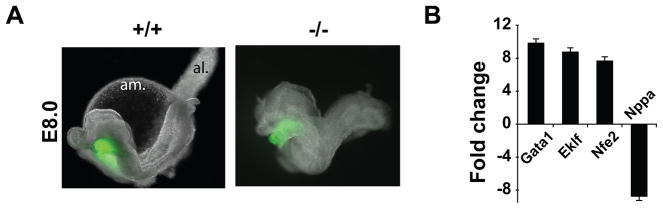
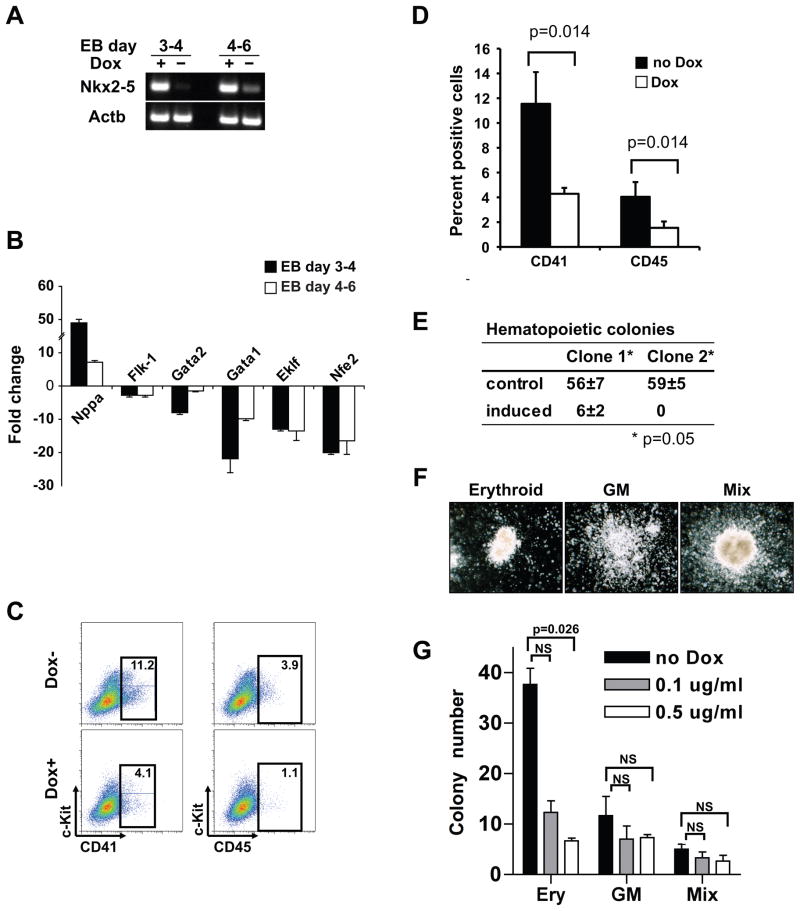
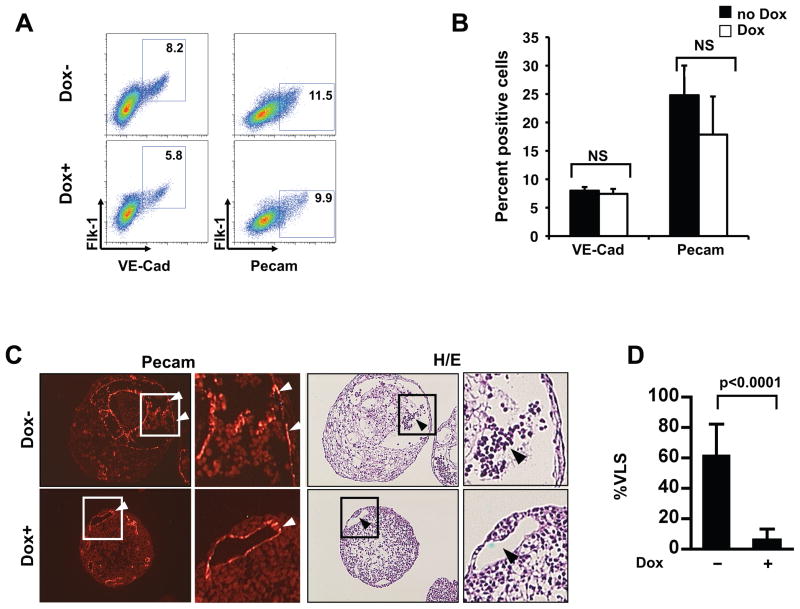
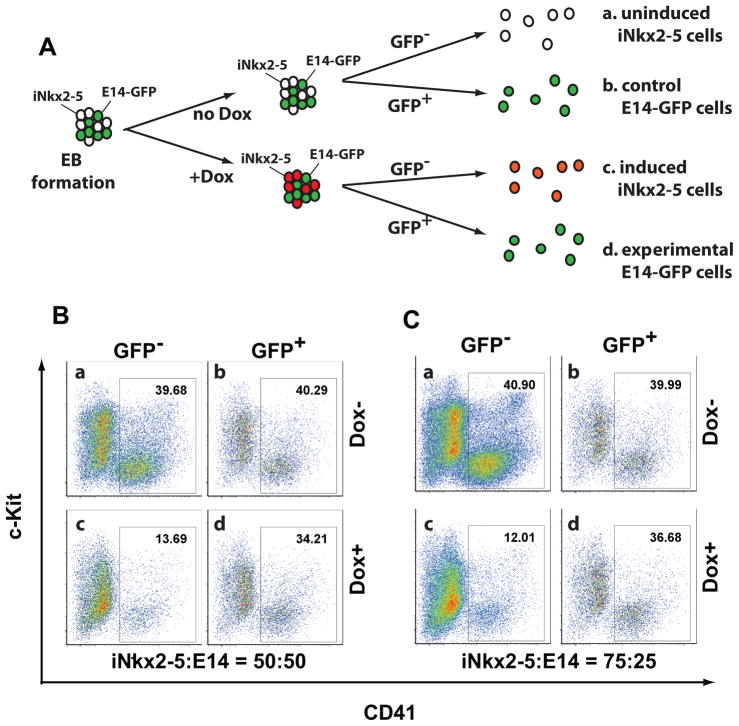
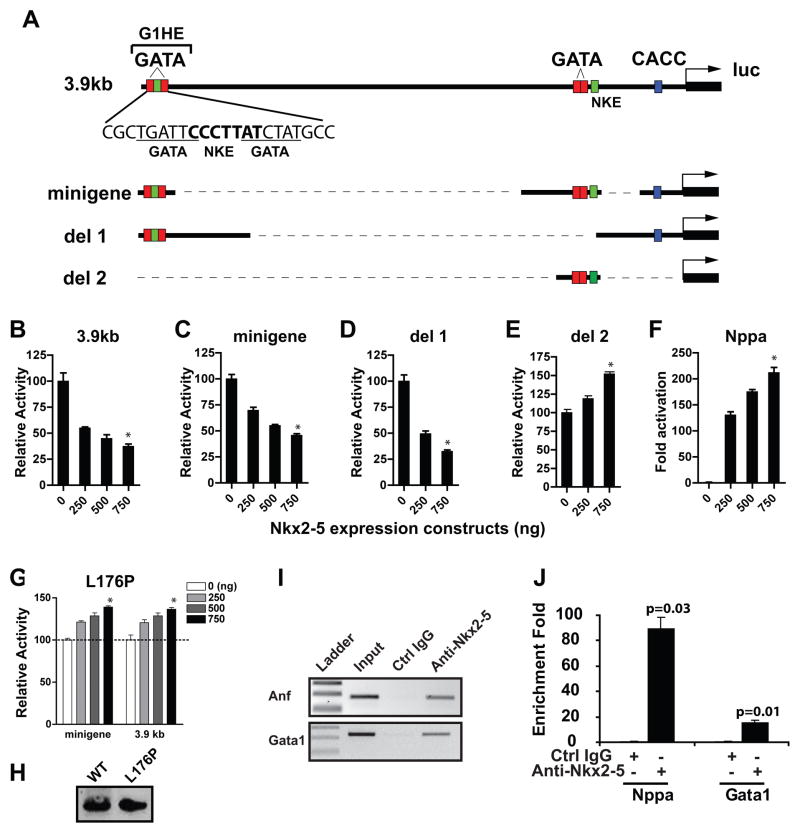
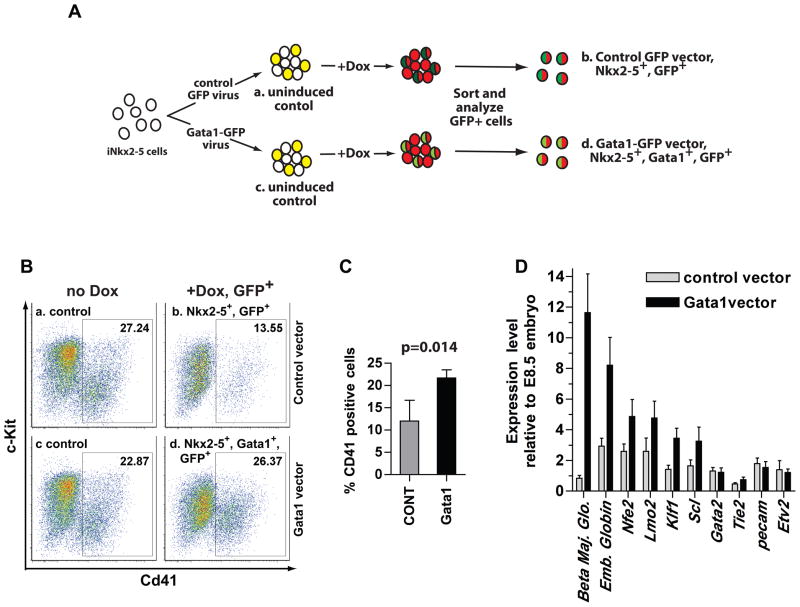
Methods and results: Here, we show that Nkx2-5 regulates the hematopoietic/erythroid fate of the mesoderm precursors early during cardiac morphogenesis. Using transgenic technologies to isolate Nkx2-5 expressing cells, we observed an induction of the erythroid molecular program, including Gata1, in the Nkx2-5-null embryos. We further observed that overexpression of Nkx2-5 with an Nkx2-5-inducible embryonic stem cell system significantly repressed Gata1 gene expression and suppressed the hematopoietic/erythroid potential, but not the endothelial potential, of the embryonic stem cells. This suppression was cell-autonomous, and was partially rescued by overexpressing Gata1. In addition, we demonstrated that Nkx2-5 binds to the Gata1 gene enhancer and represses the transcriptional activity of the Gata1 gene.

Conclusions: Our results demonstrate that the hematopoietic/erythroid cell fate is suppressed via Nkx2-5 during mesodermal fate determination, and that the Gata1 gene is one of the targets that are suppressed by Nkx2-5.


Figures

Figure 1
Figure 1. Upregulation of Gata1 expression in Nkx2-5−/− progenitors
(A) Age-matched Nkx2-5-EYFPTg/+: Nkx2-5+/+ and Nkx2-5-EYFPTg/+: Nkx2-5−/− littermate embryos at E8.0. Al: allantois, am: amnion (B) qRT-PCR shows that hematopoietic transcripts were significantly upregulated in the GFP+ population in the Nkx2-5−/− embryos. Note upregulation of Gata1 and downregulation of Nppa, a known downstream target of Nkx2-5 in the absence of Nkx2-5. Bars indicate 99% confidence interval (n = 3).
Figure 2
Figure 2. Overexpression of Nkx2-5 results in repression of the hematopoietic/erythroid lineages
(A) Induction of the Nkx2-5 transcript in iNkx2-5 cells was verified by RT-PCR. Beta-actin (Actb) is a loading control. (B) qRT-PCR analysis of Dox-treated and untreated EBs (n=6) revealed that overexpression of Nkx2-5 significantly suppressed erythroid genes including Gata1. In contrast, an Nkx2-5 downstream target gene Nppa was significantly upregulated. Bars represent 99% confidence interval (n=3). (C) FACS analysis of cell surface markers of differentiating EB cells. EBs were treated (Dox+) or left untreated (Dox-) from day 4 to day 6 and analyzed for hematopoietic markers on day 6. For early and late hematopoietic markers, combinations of c-kit/CD41 and c-kit/CD45 were used, respectively. Experiment was repeated 5 times and representative data are shown. (D) Quantification of the FACS data in C (analyzed by Mann-Whitney U test; n=5). (E & F) Induction of Nkx2-5 expression suppresses hematopoietic/erythroid colony formation. (E) Day 6 EBs from two different clones of iNkx2-5 cells were isolated and plated in complete methylcellulose in the absence (control) or presence (induced) of doxycycline (analyzed by Mann-Whitney U test after normalizing transformation; n=3). Note that little or no colony formation was observed in the presence of doxycycline, while erythroid, GM (granulocyte-macrophage) and mixed colonies were detected when EBs were cultured without doxycycline. (G) Induction of Nkx2-5 expression from day 4 to day 6 with lower concentrations of doxycycline preferentially repressed erythroid colony formation. Day 4 EBs with or without 48 hour induction with the specified concentration of doxycycline were dissociated and equal numbers of cells were plated in methylcellulose without doxycycline. Note the significant repression of erythroid (ery) colony formation compared to the GM and mixed colonies (analyzed by Mann-Whitney U test after normalizing transformation; n=3. NS: not significant).
Figure 3
Figure 3. Overexpression of Nkx2-5 does not affect endothelial differentiation of ES/EBs
(A and B) Cells from day 6 EBs treated (+Dox) or untreated (−Dox) with doxycycline for 48 hrs were analyzed for expression of indicated markers using FACS. Note that overexpression of Nkx2-5 did not affect the endothelial progenitors in the differentiating EBs. These FACS data are quantified in panel B (analyzed by one-tailed Mann-Whitney U test; n=3. NS: not significant). (C & D) Adjacent sections of treated (+Dox) and untreated (−Dox) day 6 EBs were stained with anti CD31/Pecam antibody (left) or hematoxylin and eosin (H/E; right) to analyze the formation of vessel like structures (VLS; white arrow heads) and blood cells (black arrow heads). Boxed areas are enlarged. Three hundred randomly selected VLS from 20 EBs were scored for the presence of blood cells in panel D (analyzed by one-tailed Mann-Whitney U test; n=33). Bars show SD.
Figure 4
Figure 4. Nkx2-5 suppresses hematopoiesis in a cell-autonomous fashion
(A) iNkx2-5 cells were mixed with wild-type E14-GFP cells and induced to form EBs. Cells were either treated with doxycycline from day 2 to day 4, or left untreated. On day 6, cells were dissociated and analyzed by FACS. (B, C) Representative FACS profiles from experiments in which iNkx2-5 cells and E14-GFP cells were mixed at a 50:50 ratio (B) or a 75:25 ratio (C). Note that in both conditions, the CD41+ cells originated from iNkx2-5 cells (CD41+, GFP population) were reduced upon Nkx2-5 induction (compare panels a and c), whereas those that originated from E14-GFP cells (CD41+, GFP+ population) remained unchanged (compare panels b and d).
Figure 5
Figure 5. Nkx2-5 represses Gata1 promoter activity
(A) Schematic of the 3.9 kb upstream region of the Gata1 gene and reporter plasmids used in the transcriptional assays. Two GATA binding sequences (underlined) and an Nkx2-5 consensus sequence (bolded) within the G1HE are indicated. (B–G) Transcriptional assay in K562 cells reveal a dose-dependent repression of luciferase activity by Nkx2-5 using the 3.9 kb erythroid enhancer (B) or the minigene (C). Deletion 2 (E) but not deletion 1 (D) abolished the response to Nkx2-5. (F) Nppa, a downstream target of Nkx2-5, was activated under the same condition. (G) The L176P mutation of Nkx2-5 in the homeodomain impairs its activity to repress Gata1 transcription. Panels B–G were analyzed by Kruskal-Wallis test (n=3). *:p<0.05 compared to the sample without the Nkx2-5 expression vector (0ng). Bars without an asterisk were not significant. (H) Western blot analysis from the transfected samples (500ng vector) shows that wild type protein and the L175P mutant are expressed at equivalent levels. (I, J) Chromatin was isolated from EBs of iNkx2-5 cells induced for 24 hours with doxycycline and analyzed by ChIP. Nkx2-5 antibody, but not control IgG precipitated genomic fragments containing the Gata1 and the Nppa promoter region (I). J shows quantification of the band intensity by q-PCR (analyzed by Wilcoxon signed rank test; n=4).
Figure 6
Figure 6. Gata1 partially rescues repression of hematopoiesis by Nkx2-5
(A) iNkx2-5 cells were infected with a lentiviral vector that expresses IRES-GFP, or a vector that expresses Gata1-IRES-GFP in response to doxycycline. Infected cells were enriched by sorting for GFP positive cells, and induced to form EBs. After inducing from day 4 to day 6, cells were dissociated and analyzed for CD41 expression. The GFP positive cells in the control group express Nkx2-5, and GFP (group b), whereas those in the experimental group express Nkx2-5, Gata1 and GFP (group d). (B) Representative FACS profile of groups a–d. (C) Quantification of the FACS analyses. Mean number and standard deviation from four independent experiments are shown. Data were analyzed by one-tailed Mann-Whitney U test (n=4). (D) Cells from groups b and d were collected and gene expression was analyzed by qRT-PCR. Note upregulation of hematopoietic/erythroid markers by Gata1 overexpression. Bars indicate 99% confidence interval (n=3).

Similar articles

Cited by

References

    1. Cossu G, Bianco P. Mesoangioblasts–vascular progenitors for extravascular mesodermal tissues. Curr Opin Genet Dev. 2003;13:537–542. - PubMed
    1. Mikkola HK, Orkin SH. The search for the hemangioblast. J Hematother Stem Cell Res. 2002;11:9–17. - PubMed
    1. Garry DJ, Olson EN. A common progenitor at the heart of development. Cell. 2006;127:1101–1104. - PubMed
    1. Masino AM, Gallardo TD, Wilcox CA, Olson EN, Williams RS, Garry DJ. Transcriptional regulation of cardiac progenitor cell populations. Circ Res. 2004;95:389–397. - PubMed
    1. Tanaka M, Chen Z, Bartunkova S, Yamasaki N, Izumo S. The cardiac homeobox gene Csx/Nkx2.5 lies genetically upstream of multiple genes essential for heart development. Development. 1999;126:1269–1280. - PubMed

MeSH terms