. 2011 Jun;31(12):2369-79.
doi: 10.1128/MCB.05312-11. Epub 2011 Apr 4.

Phenotypes in mTERT⁺/⁻ and mTERT⁻/⁻ mice are due to short telomeres, not telomere-independent functions of telomerase reverse transcriptase

Affiliations

Phenotypes in mTERT⁺/⁻ and mTERT⁻/⁻ mice are due to short telomeres, not telomere-independent functions of telomerase reverse transcriptase

Margaret A Strong et al. Mol Cell Biol. 2011 Jun.

Abstract

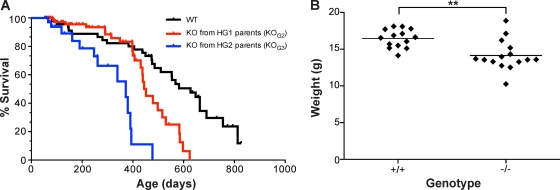
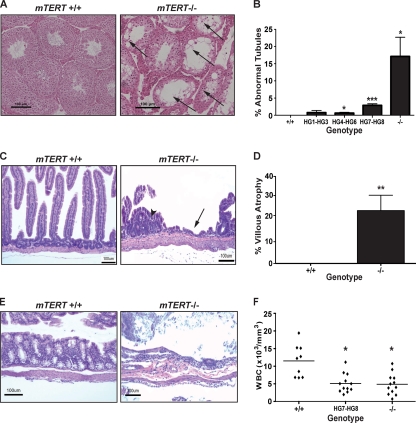
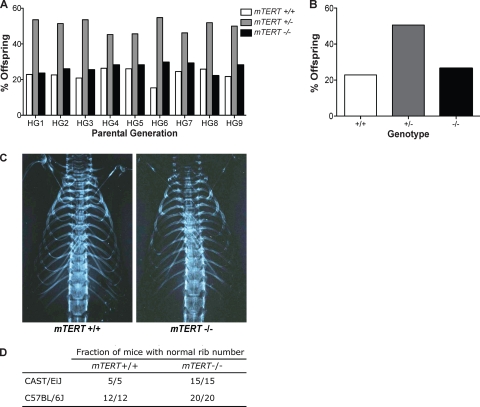
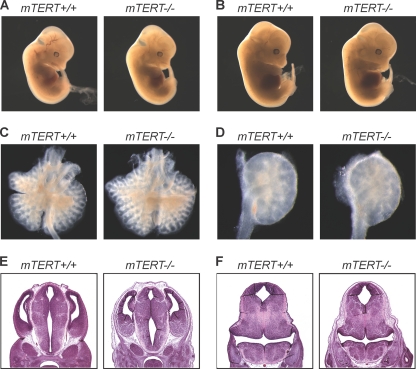
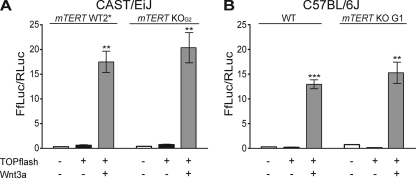
Telomerase is essential for telomere length maintenance. Mutations in either of the two core components of telomerase, telomerase RNA (TR) or the catalytic protein component telomerase reverse transcriptase (TERT), cause the genetic disorders dyskeratosis congenita, pulmonary fibrosis, and other degenerative diseases. Overexpression of the TERT protein has been reported to have telomere length-independent roles, including regulation of the Wnt signaling pathway. To examine the phenotypes of TERT haploinsufficiency and determine whether loss of function of TERT has effects other than those associated with telomere shortening, we characterized both mTERT⁺/⁻ and mTERT⁻/⁻ mice on the CAST/EiJ genetic background. Phenotypic analysis showed a loss of tissue renewal capacity with progressive breeding of heterozygous mice that was indistinguishable from that of mTR-deficient mice. mTERT⁻/⁻ mice, from heterozygous mTERT⁺/⁻ mouse crosses, were born at the expected Mendelian ratio (26.5%; n = 1,080 pups), indicating no embryonic lethality of this genotype. We looked for, and failed to find, hallmarks of Wnt deficiency in various adult and embryonic tissues, including those of the lungs, kidneys, brain, and skeleton. Finally, mTERT⁻/⁻ cells showed wild-type levels of Wnt signaling in vitro. Thus, while TERT overexpression in some settings may activate the Wnt pathway, loss of function in a physiological setting has no apparent effects on Wnt signaling. Our results indicate that both TERT and TR are haploinsufficient and that their deficiency leads to telomere shortening, which limits tissue renewal. Our studies imply that hypomorphic loss-of-function alleles of hTERT and hTR should cause a similar disease spectrum in humans.


Figures

Fig. 1.
Fig. 1.
mTERT−/− and mTERT+/− mice show telomere shortening and haploinsufficiency. (A) CAST/EiJ mTERT+/− breeding scheme and nomenclature of each generation. (B and C) Q-FISH analysis of littermates from an mTERT+/− HG1 cross. TFU represents arbitrary telomere fluorescence units. mTERT−/− KOG2 (mean = 37,688 TFU) and WT WT2* (mean = 60,461 TFU) (B) and two mTERT+/− HG2 littermates (C) are compared on the same scale (means = 49,208 and 47,625 TFU, respectively). (D) Telomere length distribution in mTERT KOG2 (mean = 23,353 TFU) and (E) mTR KOG2 mice (mean = 22,136 TFU) compared to that in WT mice (mean = 60,461 TFU).
Fig. 2.
Fig. 2.
Telomere length decreases in mTERT−/− and mTERT+/− mice analyzed by Flow-FISH. (A) Flow-FISH analysis of telomere length within one litter and compared to that in WT mice. RFU is relative fluorescence units of the telomere signal (means: WT = 552 RFU, WT6* = 515 RFU, HG6 = 414 RFU, and KOG6 = 349 RFU). (B) Telomere length comparison of two HG1 mice to two HG7 mice by Flow-FISH (geometric means: HG1 = 468 RFU, HG1 = 459 RFU, HG7 = 349 RFU, and HG7 = 315 RFU). (C) Flow-FISH analysis of six independent WT mice shows heterogeneity within mice of the same genotype. The numbers indicate the numbers of mice in our colony. (D) The quantitative Flow-FISH value, normalized RFU to bovine thymocytes as an internal control, is shown for each mouse analyzed in panel C.
Fig. 3.
Fig. 3.
mTERT−/− mice have decreased survival and body weights. (A) Kaplan-Meier survival curve for WT (n = 45), KOG2 (n = 82), and KOG3 (n = 36) mice (median survival: WT = 627 days; KOG2 = 452 days; KOG3 = 372 days). (B) Body weight analysis of WT (n = 14, average weight = 16.47 g) and mTERT−/− (KOG2 through KOG6, n = 15; average weight = 14.15 g) mice. ** indicates P = 0.0011.
Fig. 4.
Fig. 4.
mTERT−/− and mTERT +/− mice show defects in tissue renewal. (A) H&E staining of testis sections from WT (left panel) and mTERT−/− mice (right panel). Arrows show abnormal or empty tubules (magnification, ×100; scale bar = 100 μm). (B) Quantitation of abnormal tubules in mTERT+/− (HG1-HG3, n = 5; HG4-HG6, n = 6; HG7-HG8, n = 12) and mTERT−/− (n = 7) mice compared to those of WT (+/+, n = 7) mice. * indicates P < 0.05; *** indicates P = 0.0002. (C) H&E staining of small intestine sections from WT (left panel) and mTERT−/− (right panel) mice. Arrow indicates area of villous atrophy, and arrowhead indicates microadenoma (magnification, ×100; scale bar = 100 μm). (D) Quantitation of percent villous atrophy in the GI tracts of WT (+/+, n = 5) and mTERT−/− (−/−, n = 5) mice. ** indicates P = 0.003. (E) H&E staining of large intestine sections from WT (left panel) and mTERT−/− (right panel) mice. (F) White blood cell (WBC) counts of blood from WT (+/+, n = 9), mTERT+/− (HG7 and HG8, n = 12), and mTERT−/− (n = 12) mice. ** indicates P = 0.0007.
Fig. 5.
Fig. 5.
mTERT−/− mice are born in expected ratios and show no phenotypes ascribed to Wnt signaling deficiency. (A) Quantitation of Mendelian ratios of progeny from each generation of heterozygous mice. (B) Total genotype distribution from all heterozygous crosses (n = 1,089) from CAST/EiJ mTERT+/− intercrosses: 22.9% WT, 50.6% mTERT+/−, and 26.5% mTERT−/−. (C) X rays to examine rib numbers in CAST/EiJ mTERT+/+ and mTERT−/− mice. (D) Quantitation of rib numbers from X rays of WT and mTERT−/− mice in both the CAST/EiJ and C57BL/6J genetic backgrounds.
Fig. 6.
Fig. 6.
mTERT−/− embryos show no phenotypes ascribed to Wnt signaling deficiency. To look for subtle phenotypes, 58 embryos were dissected and evaluated in a blinded fashion. Representative examples are shown. E13.5 (A) and E14.5 (B) WT (left panels) and mTERT−/− (right panels) whole embryos (magnification, ×0.8; n = 12 each) are shown. (C) Embryonic lungs dissected from WT (left panel) and mTERT−/− (right panel) embryos at E14.5 (magnification, ×3.2; n = 3 each). (D) Embryonic kidneys dissected from WT (left panel) and mTERT−/− (right panel) embryos at E14.5 (magnification, ×6.6; n = 3 each). Also shown are H&E-stained midbrain (E) and cerebellar primordium (F) sections from E14.5 WT (left panels) and mTERT−/− (right panels) embryos (magnification, ×2.5; n = 3 each).
Fig. 7.
Fig. 7.
mTERT−/− cells show Wnt pathway signaling activation similar to that of WT cells in vitro. Luciferase activity was measured in MEFs transfected with the TOPflash reporter plasmid and a control Renilla luciferase reporter, with and without Wnt3a ligand (see Materials and Methods), as indicated below the graphs. (A) TOPflash luciferase assay of CAST/EiJ mTERT WT2* (**, P = 0.0015, relative to basal activation) and mTERT KOG2 (**, P = 0.0031, relative to basal activation) MEFs. (B) TOPflash luciferase assay of C57BL/6J WT (***, P = 0.0021, relative to basal activation) and mTERT KO G1 (**, P = 0.0001, relative to basal activation) MEFs.

Comment in

References

    1. Alder J. K., et al. 2008. Short telomeres are a risk factor for idiopathic pulmonary fibrosis. Proc. Natl. Acad. Sci. U. S. A. 105: 13051–13056 - PMC - PubMed
    1. Armanios M. 2009. Syndromes of telomere shortening. Annu. Rev. Genomics Hum. Genet. 10: 45–61 - PMC - PubMed
    1. Armanios M., et al. 2009. Short telomeres are sufficient to cause the degenerative defects associated with aging. Am. J. Hum. Genet. 85: 823–832 - PMC - PubMed
    1. Armanios M., et al. 2005. Haploinsufficiency of telomerase reverse transcriptase leads to anticipation in autosomal dominant dyskeratosis congenita. Proc. Natl. Acad. Sci. U. S. A. 102: 15960–15964 - PMC - PubMed
    1. Armanios M. Y., et al. 2007. Telomerase mutations in families with idiopathic pulmonary fibrosis. N. Engl. J. Med. 356: 1317–1326 - PubMed

Publication types

LinkOut - more resources