Clinical Trial
. 2011 Jun;55(6):2961-7.
doi: 10.1128/AAC.01377-10. Epub 2011 Apr 4.

Plasma and intracellular tenofovir pharmacokinetics in the neonate (ANRS 12109 trial, step 2)

Affiliations
Clinical Trial

Plasma and intracellular tenofovir pharmacokinetics in the neonate (ANRS 12109 trial, step 2)

Déborah Hirt et al. Antimicrob Agents Chemother. 2011 Jun.

Abstract

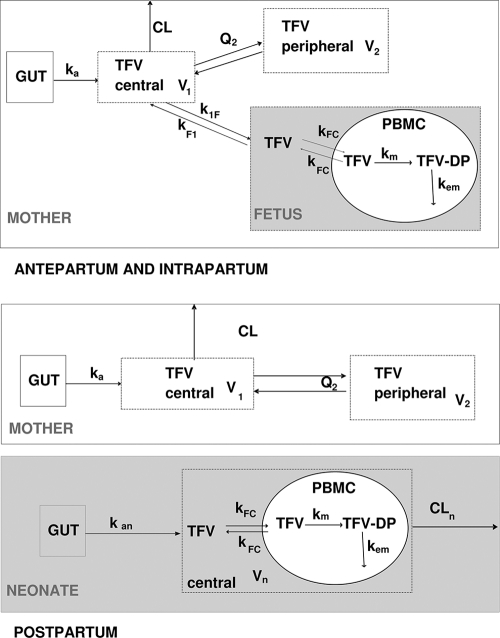
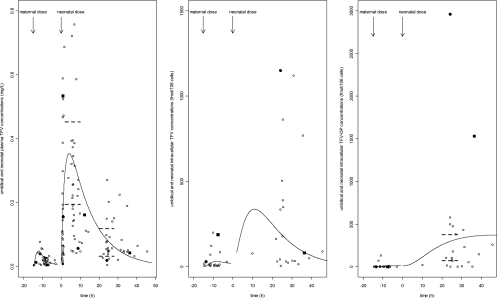
The objective of this study was to investigate for the first time tenofovir (TFV) pharmacokinetics in plasma and peripheral blood mononuclear cells (PBMCs) of the neonate. HIV-1-infected pregnant women received two tablets of tenofovir disoproxil fumarate (TDF; 300 mg) and emtricitabine (FTC; 200 mg) at onset of labor and then one tablet daily for 7 days postpartum. A single dose of 13 mg/kg of body weight of TDF was administered to 36 neonates within 12 h of life after the HIV-1-infected mothers had been administered two tablets of TDF-emtricitabine at delivery. A total of 626 samples collected within the 2 days after the drug administration were measured by liquid chromatography-tandem mass spectrometry (LC-MS/MS) and analyzed by a population approach. In the neonate, the median TFV plasma area under the curve and minimal and maximal concentrations, respectively, were 3.73 mg/liter · h and 0.076 and 0.29 mg/liter. In PBMCs, TFV concentrations were detectable in all fetuses, whereas tenofovir diphosphate (TFV-DP) was quantifiable in only two fetuses, suggesting a lag in appearance of TFV-DP. The median TFV-DP neonatal concentration was 146 fmol/10⁶ cells (interquartile range [IQR], 53 to 430 fmol/10⁶ cells); two neonates had very high TFV-DP concentrations (1,530 and 2963 fmol/10⁶ cells). The 13-mg/kg TDF dose given to neonates produced plasma TFV and intracellular active TFV-DP concentrations similar to those in adults. This dose should be given immediately after birth to reduce the delay before the active compound TFV-DP appears in cells.


Figures

Fig. 1.
Fig. 1.
Population pharmacokinetic model for the simultaneous prediction of plasma tenofovir (TFV) concentrations in the mother, the cord, and the neonate and intracellular TFV and TFV-DP in the fetus and the neonate during intrapartum and postpartum. A two-compartment model with first-order absorption and elimination best described the maternal data. An “effect” compartment model linked to the maternal circulation best described cord concentrations. A one-compartment model with first-order absorption and elimination was sufficient to describe neonatal concentrations. An effect compartment linked to the fetal/neonatal circulation was used to describe TFV in PBMCs. An additional compartment was used for TFV-DP in PBMCs with first-order reactions for TFV to TFV-DP metabolism and TFV-DP elimination. F denotes the bioavailability, ka the maternal absorption rate constant, CL the maternal elimination clearance from the central compartment, V1 the volume of the central maternal compartment, Q2 the maternal intercompartmental clearance, V2 the volume of the peripheral maternal compartment, k1F the maternal-to-fetal rate constant, kF1 the fetal-to-maternal rate constant, kan the neonatal absorption rate constant, Vn/F the apparent neonatal volume of distribution, CLn/F the apparent neonatal elimination clearance; kFC the TFV cell transfer rate constant, km the TFV to TFV-DP metabolism constant rate, and kem the TFV-DP elimination constant rate.
Fig. 2.
Fig. 2.
Evaluation of the final model: comparison between the 5th (dashed line), 50th (full line), and 95th (dashed line) percentiles obtained from 1,000 simulations and the observed data (points) for tenofovir plasma concentrations (top four panels) in the mother during all treatments (i.e., samples at delivery; 1, 2, 3, 5, 8, 12, and 24 h after the administration of 600 mg TDF; and 24 h after the 1st, 2nd or 3rd, and 7th administrations of 300 mg TDF [top left]) and at delivery only (top right), in the cord (bottom left) and neonate (bottom right), and for intracellular concentrations in PBMCs (bottom four panels) with TFV in the fetus (top left), TFV in the neonate (top right), TFV-DP in the fetus (bottom left), and TFV-DP in the neonate (bottom right). Solid symbols represent plasma TFV concentrations in the two mothers (at delivery) and fetuses for which the mother did not deliver within the 12 h after drug intake and to whom was readministered two tablets of TDF-FTC. Crosses with the data points represent the concentrations under the limit of quantification.
Fig. 3.
Fig. 3.
Fetus/neonate observed (data points) and predicted (lines) TFV concentrations in plasma (left), TFV concentrations in PBMCs (middle), and TFV-DP concentrations in PBMCs (right), as a function of time. A median delay of 6 h between maternal administration and delivery and a median delay of 9 h between birth and neonatal administration was used to represent fetal/neonatal concentrations. In the left panel, the dashed lines correspond to the IQR for the plasma TFV peak concentrations (0.195 to 0.453 mg/liter) (17, 20) and the IQR for the plasma TFV trough concentrations (0.033 to 0.119 mg/liter (17, 20) in adults. In the right panel, the dashed lines correspond to the IQR for IC TFV-DP concentrations in adults (70 to 376.5 fmol/106 cells) (17, 20). Black points and black squares correspond to concentrations of TFV in plasma, TFV in PBMCs, and TFV-DP in PBMCs of the two neonates who had very high TFV-DP concentrations.

References

    1. Anderson P. L., Kakuda T. N., Lichtenstein K. A. 2004. The cellular pharmacology of nucleoside- and nucleotide-analogue reverse-transcriptase inhibitors and its relationship to clinical toxicities. Clin. Infect. Dis. 38:743–753 - PubMed
    1. Arrive E., et al. 2009. Tolerance and viral resistance after single-dose nevirapine with tenofovir and emtricitabine to prevent vertical transmission of HIV-1. AIDS 23:825–833 - PubMed
    1. Arrive E., et al. 2007. Prevalence of resistance to nevirapine in mothers and children after single-dose exposure to prevent vertical transmission of HIV-1: a meta-analysis. Int. J. Epidemiol. 36:1009–1021 - PubMed
    1. Benaboud S., et al. 2011. Concentrations of tenofovir and emtricitabine in breast milk of HIV-1 infected women in Abidjan, Côte d'Ivoire, in the ANRS 12109 TEmAA Study, Step 2. Antimicrob. Agents Chemother. 55:1315–1317 - PMC - PubMed
    1. Benech H., et al. 2004. Peripheral blood mononuclear cell counting using a DNA-detection-based method. Anal. Biochem. 330:172–174 - PubMed

Publication types

MeSH terms