

Effect of acute hypoglycemia on human cerebral glucose metabolism measured by ¹³C magnetic resonance spectroscopy
- PMID: 21464446
- PMCID: PMC3292319
- DOI: 10.2337/db10-1592
Effect of acute hypoglycemia on human cerebral glucose metabolism measured by ¹³C magnetic resonance spectroscopy
Abstract
Objective: To investigate the effect of acute insulin-induced hypoglycemia on cerebral glucose metabolism in healthy humans, measured by (13)C magnetic resonance spectroscopy (MRS).
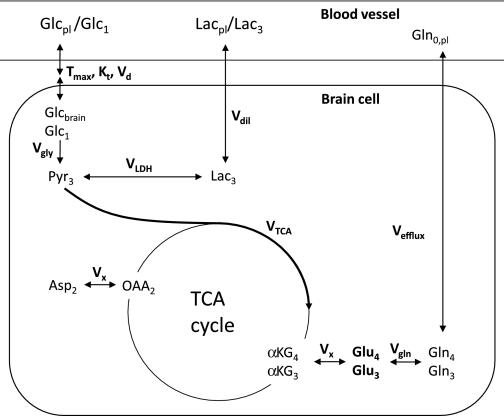
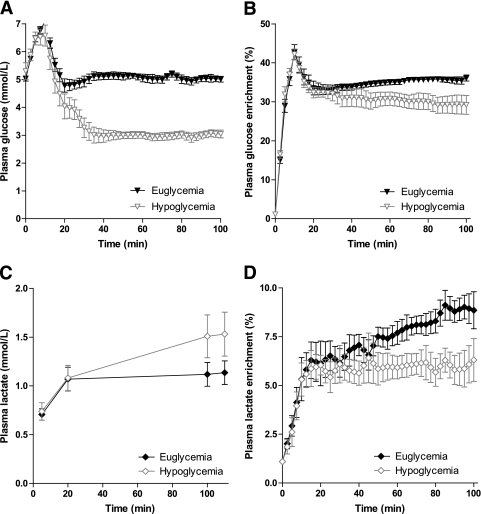
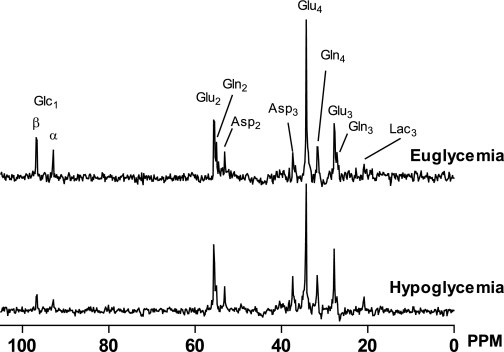
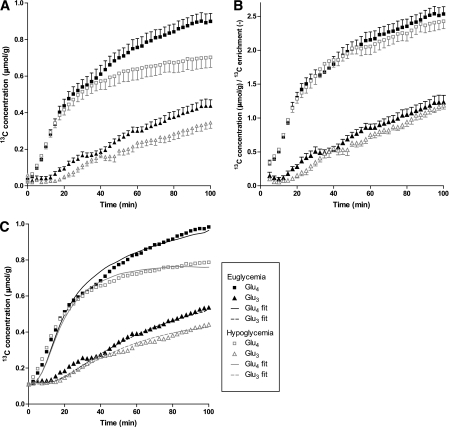
Research design and methods: Hyperinsulinemic glucose clamps were performed at plasma glucose levels of 5 mmol/L (euglycemia) or 3 mmol/L (hypoglycemia) in random order in eight healthy subjects (four women) on two occasions, separated by at least 3 weeks. Enriched [1-(13)C]glucose 20% w/w was used for the clamps to maintain stable plasma glucose labeling. The levels of the (13)C-labeled glucose metabolites glutamate C4 and C3 were measured over time in the occipital cortex during the clamp by continuous (13)C MRS in a 3T magnetic resonance scanner. Time courses of glutamate C4 and C3 labeling were fitted using a one-compartment model to calculate metabolic rates in the brain.
Results: Plasma glucose (13)C isotopic enrichment was stable at 35.1 ± 1.8% during euglycemia and at 30.2 ± 5.5% during hypoglycemia. Hypoglycemia stimulated release of counterregulatory hormones (all P < 0.05) and tended to increase plasma lactate levels (P = 0.07). After correction for the ambient (13)C enrichment values, label incorporation into glucose metabolites was virtually identical under both glycemic conditions. Calculated tricarboxylic acid cycle rates (V(TCA)) were 0.48 ± 0.03 μmol/g/min during euglycemia and 0.43 ± 0.08 μmol/g/min during hypoglycemia (P = 0.42).
Conclusions: These results indicate that acute moderate hypoglycemia does not affect fluxes through the main pathways of glucose metabolism in the brain of healthy nondiabetic subjects.
Figures
Comment in
-
Insulin-induced hypoglycemia and its effect on the brain: unraveling metabolism by in vivo nuclear magnetic resonance.Diabetes. 2011 Jul;60(7):1856-8. doi: 10.2337/db11-0498. Diabetes. 2011. PMID: 21709281 Free PMC article. No abstract available.
References
-
- Friers BM, Fisher BM. (Eds.). Hypoglycemia in Clinical Diabetes. New York, Wiley, 1999
-
- Cox DJ, Gonder-Frederick LA, Kovatchev BP, Julian DM, Clarke WL. Progressive hypoglycemia’s impact on driving simulation performance: occurrence, awareness and correction. Diabetes Care 2000;23:163–170 - PubMed
-
- Veneman T, Mitrakou A, Mokan M, Cryer P, Gerich J. Induction of hypoglycemia unawareness by asymptomatic nocturnal hypoglycemia. Diabetes 1993;42:1233–1237 - PubMed
-
- Maran A, Crepaldi C, Trupiani S, et al. Brain function rescue effect of lactate following hypoglycaemia is not an adaptation process in both normal and type I diabetic subjects. Diabetologia 2000;43:733–741 - PubMed
Publication types
MeSH terms
Substances
Grants and funding
LinkOut - more resources
Full Text Sources
Medical
Miscellaneous
