. 2011 Jun;156(2):974-84.
doi: 10.1104/pp.111.176248. Epub 2011 Apr 4.

EOBII controls flower opening by functioning as a general transcriptomic switch

Affiliations

EOBII controls flower opening by functioning as a general transcriptomic switch

Thomas A Colquhoun et al. Plant Physiol. 2011 Jun.

Abstract

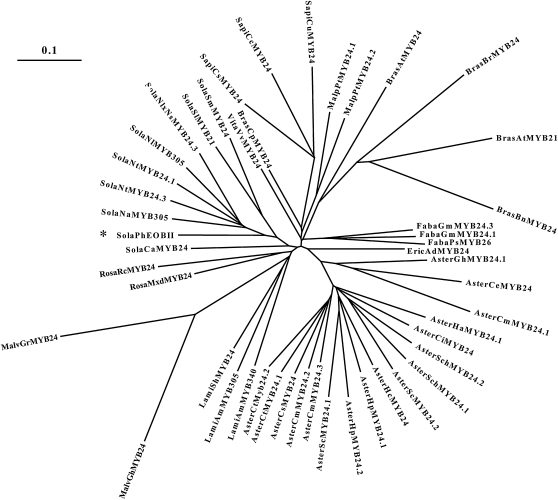
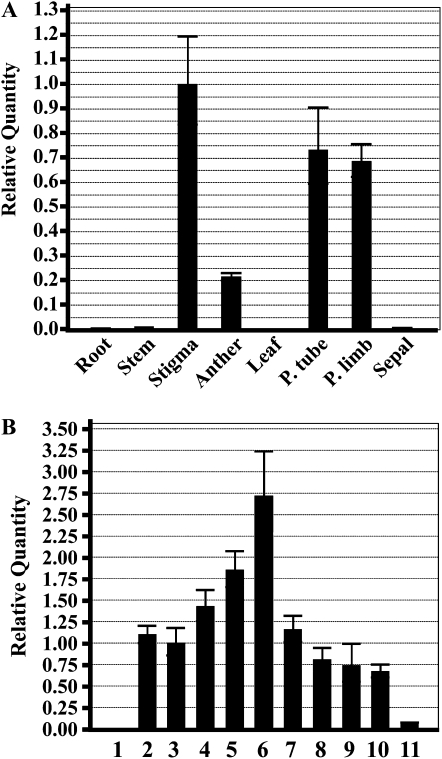
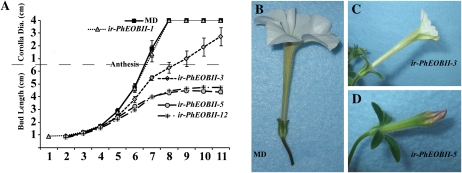
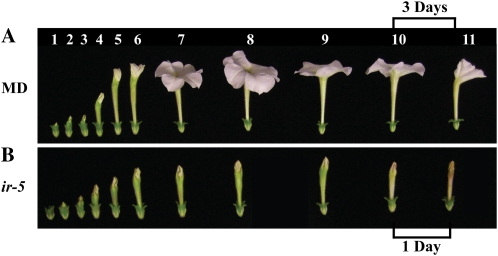
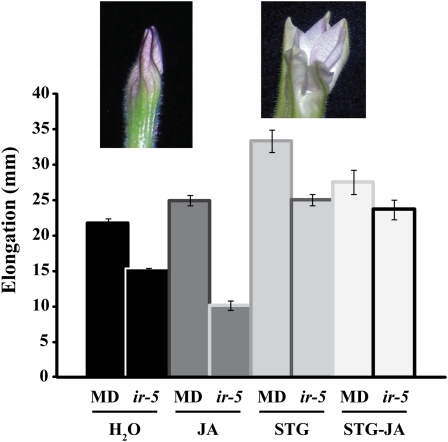
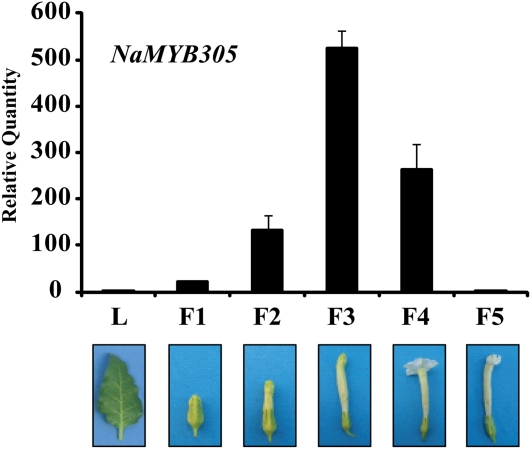
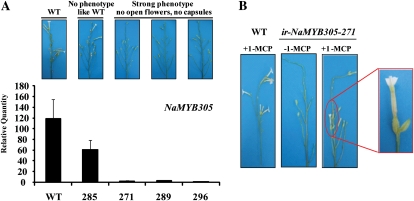
R2R3-MYB transcription factors (TFs) are involved in diverse aspects of plant biology. Recently an R2R3-MYB was identified in Petunia x hybrida line P720 to have a role in the transcriptional regulation of floral volatile production. We propose a more foundational role for the R2R3-MYB TF EMISSION OF BENZENOIDS II (EOBII). The homolog of EOBII was isolated and characterized from P. x hybrida 'Mitchell Diploid' (MD) and Nicotiana attenuata. For both MD and N. attenuata, EOBII transcript accumulates to high levels in floral tissue with maximum accumulation at flower opening. When EOBII transcript levels are severely reduced using a stable RNAi (ir) approach in MD and N. attenuata, ir-EOBII flowers fail to enter anthesis and prematurely senesce. Transcript accumulation analysis demonstrated core phenylpropanoid pathway transcripts and cell wall modifier transcript levels are altered in ir-EOBII flowers. These flowers can be partially complemented by feeding with a sucrose, t-cinnamic acid, and gibberellic acid solution; presumably restoring cellular aspects sufficient for flower opening. Additionally, if ethylene sensitivity is blocked in either MD or N. attenuata, ir-EOBII flowers enter anthesis. These experiments demonstrate one R2R3-MYB TF can control a highly dynamic process fundamental to sexual reproduction in angiosperms: the opening of flowers.


Figures

Figure 1.
Figure 1.
An unrooted neighbor-joining tree of PhEOBII-like amino acid sequences. TREEVIEW (Win32) software version 1.6.6, nearest-joining method, was used to create the resulting phylogenetic tree. Scale bar represents distance as the number of substitutions per site (i.e. 0.1 amino acid substitutions per site). An asterisk denotes the PhEOBII sequence.
Figure 2.
Figure 2.
qRT-PCR transcript accumulation analysis of PhEOBII from MD plants. A, Spatial analysis used total RNA from root, stem, stigma, anther, leaf, petal (P.) tube, petal (P.) limb, and sepal tissues collected at 4 pm (mean ± se; n = 3). B, Floral developmental analysis used total RNA from staged flower tissues collected at 4 pm of the same day (mean ± se; n = 3). Stage 1 represents a 1-cm floral bud from the base of the receptacle to the tip of the emerging corolla tissue. Each stage is developmentally separated by approximately 1 d, except for stages 10 and 11, where 3 d separates the stages (adapted from Colquhoun et al., 2010b). All histograms are representative of multiple experiments with multiple biological replicates.
Figure 3.
Figure 3.
Phenotypic growth comparison of MD and T0 ir-PhEOBII flowers. Shown are representatives from transgenic plants showing a wild type (ir-PhEOBII-1), an intermediate (ir-PhEOBII-3), and two strong floral phenotypes (ir-PhEOBII-5 and 12). A, All flower buds were tagged at a 1-cm bud and followed through development (mean ± se; n = 12). B to d, Pictures of the ir-PhEOBII phenotype. B, An entire open MD flower. C, A semiopening flower from an intermediate line, ir-PhEOBII-3. D, A nonopening flower from a strong phenotype line, ir-PhEOBII-5. [See online article for color version of this figure.]
Figure 4.
Figure 4.
Relation of MD floral development and a T2 ir-PhEOBII homozygous line. A, Developmentally staged MD flowers from a small bud, stage 1; 1 cm, to a senescing flower, stage 11 (adapted from Colquhoun et al., 2010b). B, Developmentally staged flowers from the ir-PhEOBII-5 (ir-5) homozygous line. Approximately 1 d separates each stage except for stages 10 and 11 from MD flowers, where these stages are separated by 3 d. [See online article for color version of this figure.]
Figure 5.
Figure 5.
Comparative transcript accumulation analysis using MD and ir-5 flowers. A to d, Developmentally staged flowers (an abbreviated staging since ir-5 flowers initially differs from MD between stage 4 and 5) were collected on one day at 4 pm. qPCR was carried out with 10 times diluted cDNA samples and run with the ΔΔCt method using PhFBP1 as an internal reference. Histograms are representative of two biological replicates (mean ± se; n = 3).
Figure 6.
Figure 6.
Feeding experiments with excised MD and ir-5 flowers. All flowers were excised at 3 cm and placed in solutions indicated: water, 50 μm JA, and STG. Growth was measured every 24 h in millimeters (mean ± se; n = 15). Inset pictures are representative of the ir-5 flowers used in this experiment after four days of feeding. [See online article for color version of this figure.]
Figure 7.
Figure 7.
Complementation of the ir-PhEOBII phenotype by ethylene insensitivity. Shown are developmentally staged ir-5, and 44568 × ir-5 flowers, from a small bud (stage 1, 1 cm) to a senescing flower (stage 11). Approximately 1 d separates each stage except for stages 10 and 11 in the 44568 ×× ir-5 line, where 10 and 11 are separated by approximately 6 d. [See online article for color version of this figure.]
Figure 8.
Figure 8.
Transcript accumulation of the PhEOBII homolog in N. attenuata, NaMYB305. qPCR analysis of NaMYB305 transcript accumulation through the development of a N. attenuata flower (mean ± se; n = 3). The level of NaMYB305 transcript in floral tissue is set relative to the level in leaf tissue. [See online article for color version of this figure.]
Figure 9.
Figure 9.
A reduction of NaMYB305 transcript levels in N. attenuata by RNAi. A, Transcript accumulation of NaMYB305 levels in representative T0 ir-NaMYB305 lines compared to wild-type N. attenuata (mean ± se; n = 3) with phenotypic pictures and descriptions included. B, Complementation study using MCP to block ethylene sensitivity in N. attenuata and ir-NaMYB305 with a magnified inset picture of an ir-NaMYB305 that has entered anthesis. [See online article for color version of this figure.]

References

    1. Ashe HL, Briscoe J. (2006) The interpretation of morphogen gradients. Development 133: 385–394 - PubMed
    1. Baldwin IT. (1998) Jasmonate-induced responses are costly but benefit plants under attack in native populations. Proc Natl Acad Sci USA 95: 8113–8118 - PMC - PubMed
    1. Ben-Nissan G, Weiss D. (1996) The petunia homologue of tomato gast1: transcript accumulation coincides with gibberellin-induced corolla cell elongation. Plant Mol Biol 32: 1067–1074 - PubMed
    1. Bonasio R, Tu S, Reinberg D. (2010) Molecular signals of epigenetic states. Science 330: 612–616 - PMC - PubMed
    1. Coen ES, Meyerowitz EM. (1991) The war of the whorls: genetic interactions controlling flower development. Nature 353: 31–37 - PubMed

Publication types

MeSH terms