

Enhanced transduction and replication of RGD-fiber modified adenovirus in primary T cells
- PMID: 21464908
- PMCID: PMC3065494
- DOI: 10.1371/journal.pone.0018091
Enhanced transduction and replication of RGD-fiber modified adenovirus in primary T cells
Abstract
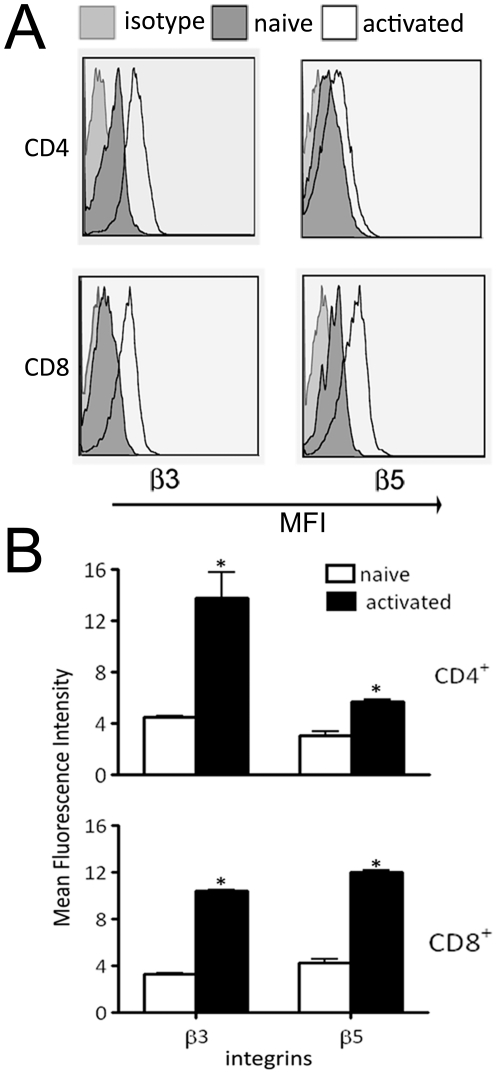
Background: Adenoviruses are often used as vehicles to mediate gene delivery for therapeutic purposes, but their research scope in hematological cells remains limited due to a narrow choice of host cells that express the adenoviral receptor (CAR). T cells, which are attractive targets for gene therapy of numerous diseases, remain resistant to adenoviral infection because of the absence of CAR expression. Here, we demonstrate that this resistance can be overcome when murine or human T cells are transduced with an adenovirus incorporating the RGD-fiber modification (Ad-RGD).
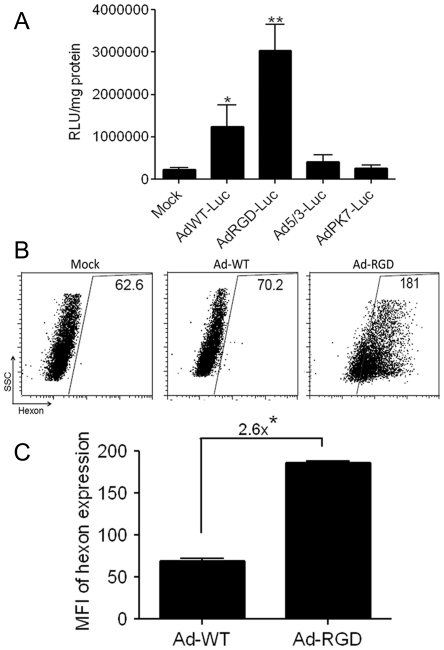
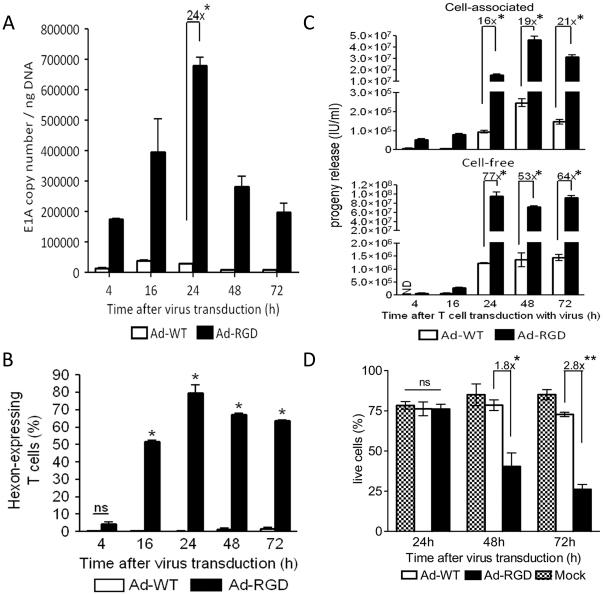
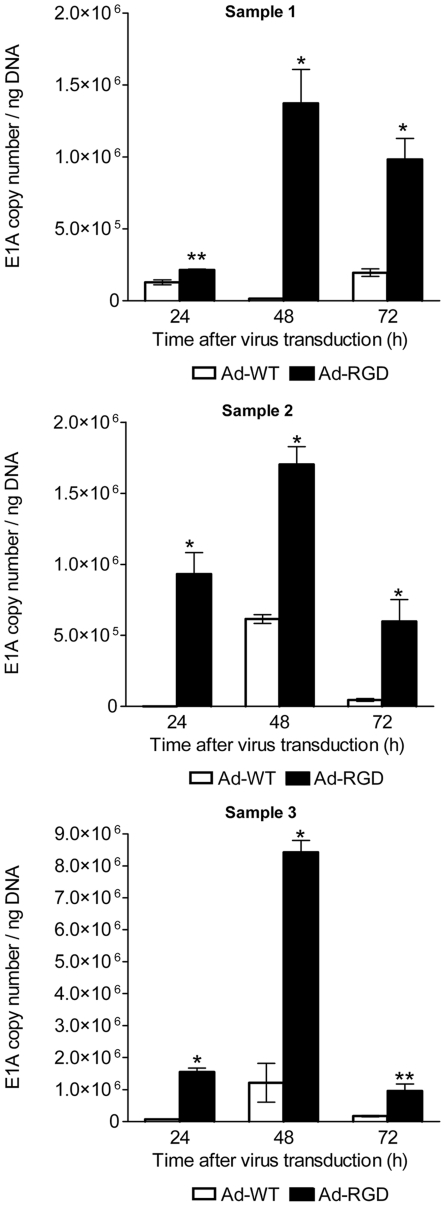
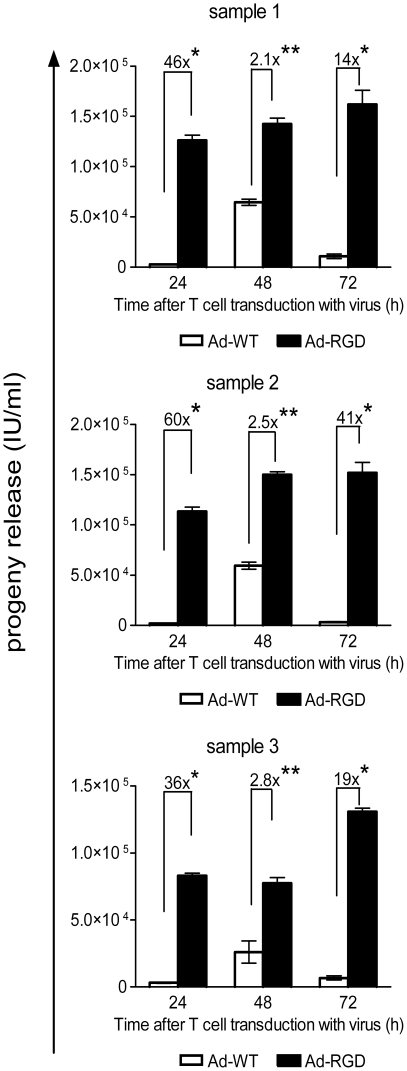
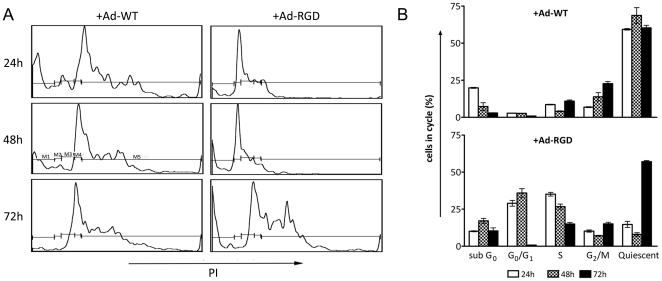
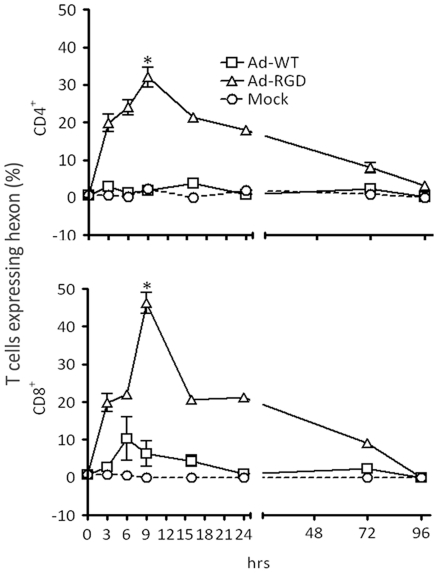
Methodology/principal finding: A luciferase-expressing replication-deficient Ad-RGD infected 3-fold higher number of activated primary T cells than an adenovirus lacking the RGD-fiber modification in vitro. Infection with replication-competent Ad-RGD virus also caused increased cell cycling, higher E1A copy number and enriched hexon antigen expression in both human and murine T cells. Transduction with oncolytic Ad-RGD also resulted in higher titers of progeny virus and enhanced the killing of T cells. In vivo, 35-45% of splenic T cells were transduced by Ad-RGD.
Conclusions: Collectively, our results prove that a fiber modified Ad-RGD successfully transduces and replicates in primary T cells of both murine and human origin.
Conflict of interest statement
Figures
Similar articles
-
E1A, E1B double-restricted adenovirus with RGD-fiber modification exhibits enhanced oncolysis for CAR-deficient biliary cancers.Clin Cancer Res. 2007 May 15;13(10):3043-50. doi: 10.1158/1078-0432.CCR-06-2103. Clin Cancer Res. 2007. PMID: 17505007
-
Conditionally replication-competent adenoviral vectors with enhanced infectivity for use in gene therapy of melanoma.Hum Gene Ther. 2004 Jul;15(7):637-47. doi: 10.1089/1043034041361181. Hum Gene Ther. 2004. PMID: 15242524
-
Engineering conditionally replication-competent adenoviral vectors carrying the cytosine deaminase gene increases the infectivity and therapeutic effect for breast cancer gene therapy.Cancer Gene Ther. 2006 Apr;13(4):346-56. doi: 10.1038/sj.cgt.7700906. Cancer Gene Ther. 2006. PMID: 16179927
-
Arg-Gly-Asp (RGD)-Modified E1A/E1B Double Mutant Adenovirus Enhances Antitumor Activity in Prostate Cancer Cells In Vitro and in Mice.PLoS One. 2016 Jan 22;11(1):e0147173. doi: 10.1371/journal.pone.0147173. eCollection 2016. PLoS One. 2016. PMID: 26799485 Free PMC article.
-
Fetal muscle gene transfer is not enhanced by an RGD capsid modification to high-capacity adenoviral vectors.Gene Ther. 2003 Oct;10(21):1821-9. doi: 10.1038/sj.gt.3302084. Gene Ther. 2003. PMID: 12960972
Cited by
-
Adenovirus Type 6: Subtle Structural Distinctions from Adenovirus Type 5 Result in Essential Differences in Properties and Perspectives for Gene Therapy.Pharmaceutics. 2021 Oct 8;13(10):1641. doi: 10.3390/pharmaceutics13101641. Pharmaceutics. 2021. PMID: 34683934 Free PMC article. Review.
-
Cholecystokinin responsiveness varies across the population dependent on metabolic phenotype.Am J Clin Nutr. 2017 Aug;106(2):447-456. doi: 10.3945/ajcn.117.156943. Epub 2017 Jun 7. Am J Clin Nutr. 2017. PMID: 28592602 Free PMC article.
-
Human umbilical cord matrix-derived stem cells expressing interferon-β gene inhibit breast cancer cells via apoptosis.Oncotarget. 2016 Jun 7;7(23):34172-9. doi: 10.18632/oncotarget.8997. Oncotarget. 2016. PMID: 27129156 Free PMC article.
-
Enhanced EJ Cell Killing of (125)I Radiation by Combining with Cytosine Deaminase Gene Therapy Regulated by Synthetic Radio-Responsive Promoter.Cancer Biother Radiopharm. 2015 Oct;30(8):342-8. doi: 10.1089/cbr.2015.1862. Epub 2015 Sep 18. Cancer Biother Radiopharm. 2015. PMID: 26382009 Free PMC article.
-
Evaluation of a Fiber-Modified Adenovirus Vector Vaccine against Foot-and-Mouth Disease in Cattle.Clin Vaccine Immunol. 2015 Nov 25;23(2):125-36. doi: 10.1128/CVI.00426-15. Clin Vaccine Immunol. 2015. PMID: 26607309 Free PMC article.
References
-
- Bergelson JM, Cunningham JA, Droguett G, Kurt-Jones EA, Krithivas A, et al. Isolation of a common receptor for Coxsackie B viruses and adenoviruses 2 and 5. Science. 1997;275:1320–1323. - PubMed
-
- Wickham TJ, Mathias P, Cheresh DA, Nemerow GR. Integrins alpha v beta 3 and alpha v beta 5 promote adenovirus internalization but not virus attachment. Cell. 1993;73:309–319. - PubMed
Publication types
MeSH terms
Substances
Grants and funding
LinkOut - more resources
Full Text Sources
Other Literature Sources
