

Experimental measurement of dynamic fluid shear stress on the ventricular surface of the aortic valve leaflet
- PMID: 21465260
- PMCID: PMC4390397
- DOI: 10.1007/s10237-011-0306-2
Experimental measurement of dynamic fluid shear stress on the ventricular surface of the aortic valve leaflet
Abstract
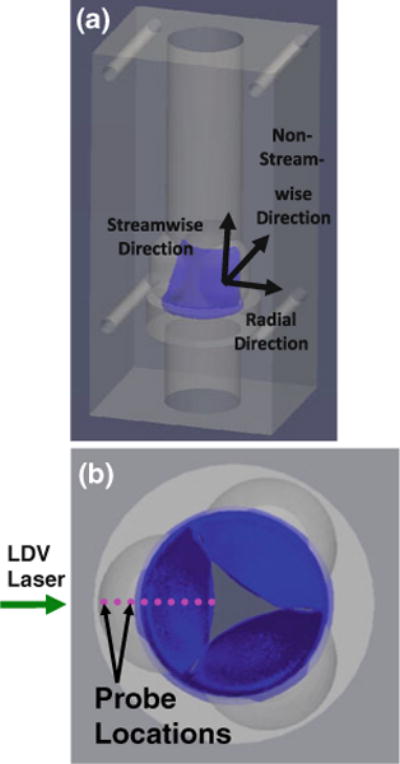
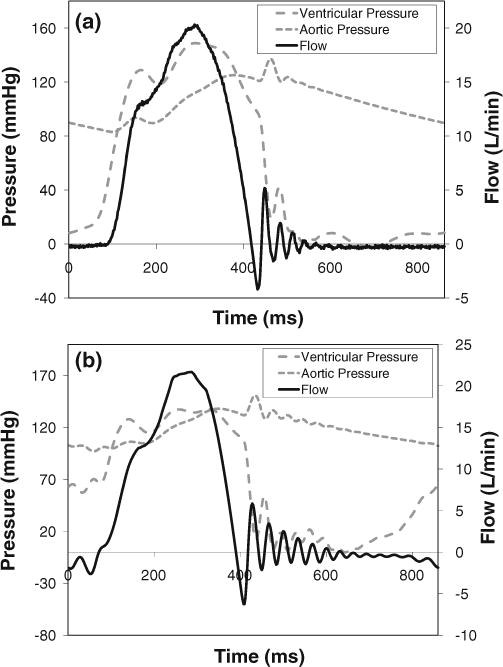
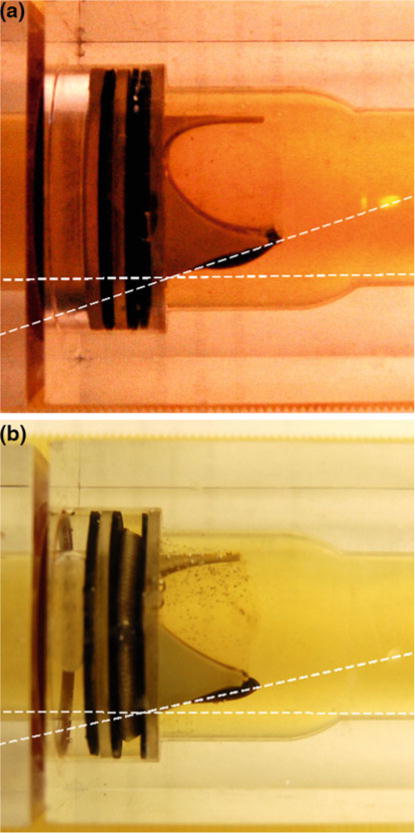
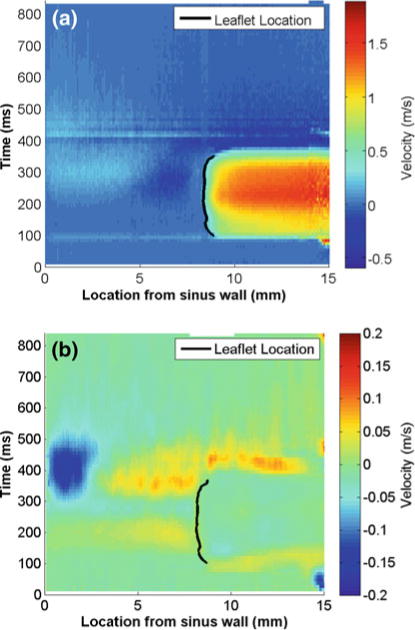
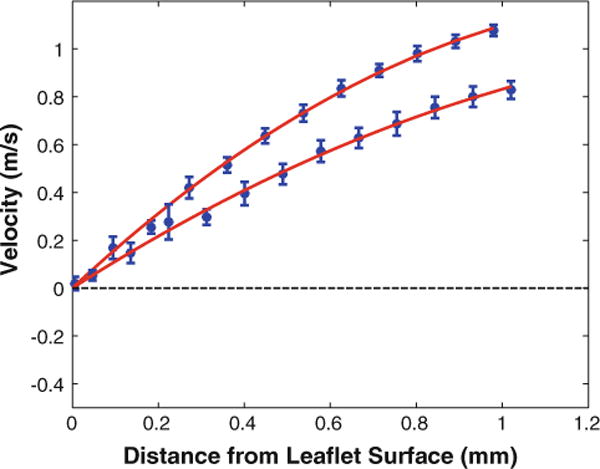
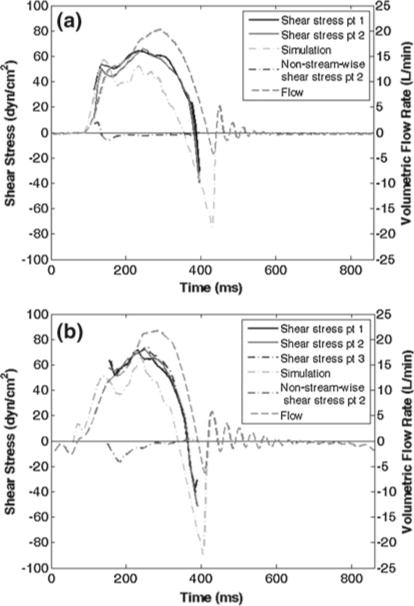
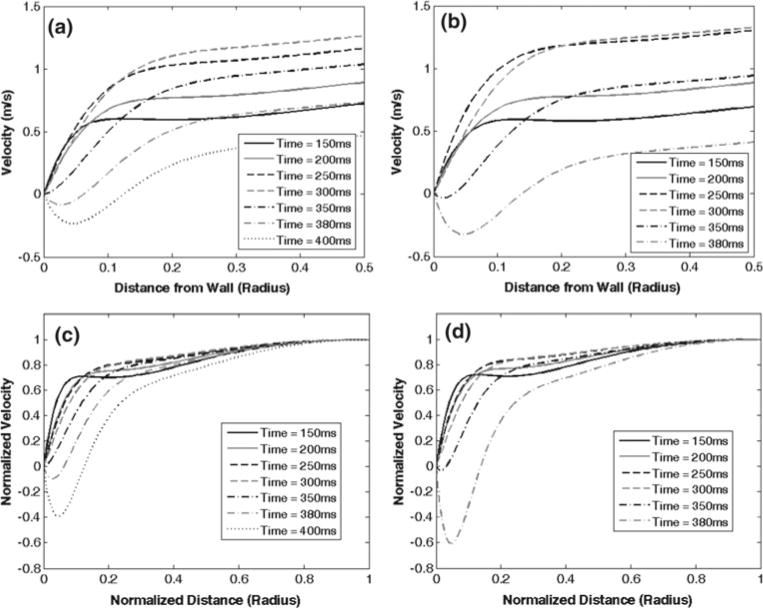
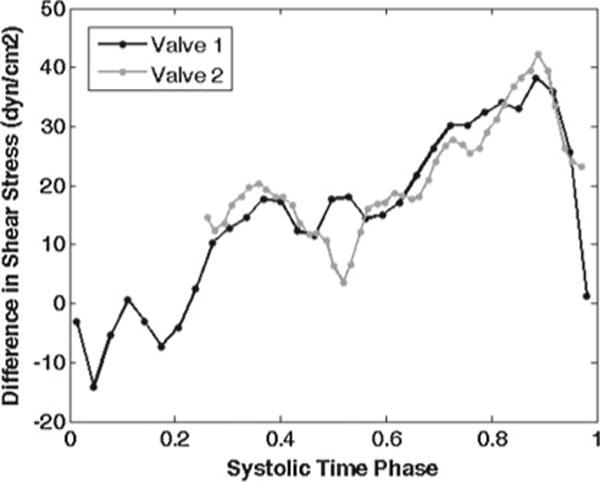
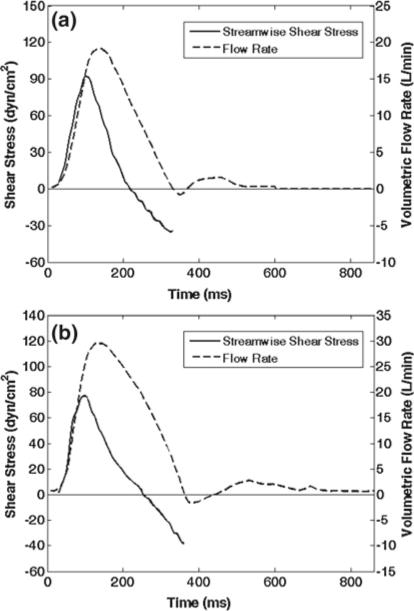
Aortic valve (AV) calcification is a highly prevalent disease with serious impact on mortality and morbidity. The exact causes and mechanisms of AV calcification are unclear, although previous studies suggest that mechanical forces play a role. It has been clinically demonstrated that calcification preferentially occurs on the aortic surface of the AV. This is hypothesized to be due to differences in the mechanical environments on the two sides of the valve. It is thus necessary to characterize fluid shear forces acting on both sides of the leaflet to test this hypothesis. The current study is one of two studies characterizing dynamic shear stress on both sides of the AV leaflets. In the current study, shear stresses on the ventricular surface of the AV leaflets were measured experimentally on two prosthetic AV models with transparent leaflets in an in vitro pulsatile flow loop using two-component Laser Doppler Velocimetry (LDV). Experimental measurements were utilized to validate a theoretical model of AV ventricular surface shear stress based on the Womersley profile in a straight tube, with corrections for the opening angle of the valve leaflets. This theoretical model was applied to in vivo data based on MRI-derived volumetric flow rates and valve dimension obtained from the literature. Experimental results showed that ventricular surface shear stress was dominated by the streamwise component. The systolic shear stress waveform resembled a half-sinusoid during systole and peaks at 64-71 dyn/cm(2), and reversed in direction at the end of systole for 15-25 ms, and reached a significant negative magnitude of 40-51 dyn/cm(2). Shear stresses from the theoretical model applied to in vivo data showed that shear stresses peaked at 77-92 dyn/cm(2) and reversed in direction for substantial period of time (108-110 ms) during late systole with peak negative shear stress of 35-38 dyn/cm(2).
Figures


Similar articles
-
Experimental measurement of dynamic fluid shear stress on the aortic surface of the aortic valve leaflet.Biomech Model Mechanobiol. 2012 Jan;11(1-2):171-82. doi: 10.1007/s10237-011-0301-7. Epub 2011 Mar 18. Biomech Model Mechanobiol. 2012. PMID: 21416247 Free PMC article.
-
Experimental technique of measuring dynamic fluid shear stress on the aortic surface of the aortic valve leaflet.J Biomech Eng. 2011 Jun;133(6):061007. doi: 10.1115/1.4004232. J Biomech Eng. 2011. PMID: 21744927
-
The congenital bicuspid aortic valve can experience high-frequency unsteady shear stresses on its leaflet surface.Am J Physiol Heart Circ Physiol. 2012 Sep 15;303(6):H721-31. doi: 10.1152/ajpheart.00829.2011. Epub 2012 Jul 20. Am J Physiol Heart Circ Physiol. 2012. PMID: 22821994 Free PMC article.
-
Aortic valve: mechanical environment and mechanobiology.Ann Biomed Eng. 2013 Jul;41(7):1331-46. doi: 10.1007/s10439-013-0785-7. Epub 2013 Mar 21. Ann Biomed Eng. 2013. PMID: 23515935 Free PMC article. Review.
-
Studies on stress distribution in pavements subjected to surface shear forces.Proc Jpn Acad Ser B Phys Biol Sci. 2014;90(2):47-55. doi: 10.2183/pjab.90.47. Proc Jpn Acad Ser B Phys Biol Sci. 2014. PMID: 24522154 Free PMC article. Review.
Cited by
-
Shear Stress Quantification in Tissue Engineering Bioreactor Heart Valves: A Computational Approach.J Funct Biomater. 2024 Mar 20;15(3):76. doi: 10.3390/jfb15030076. J Funct Biomater. 2024. PMID: 38535269 Free PMC article.
-
Validation and Extension of a Fluid-Structure Interaction Model of the Healthy Aortic Valve.Cardiovasc Eng Technol. 2018 Dec;9(4):739-751. doi: 10.1007/s13239-018-00391-1. Epub 2018 Nov 7. Cardiovasc Eng Technol. 2018. PMID: 30406610 Free PMC article.
-
Effects of shear stress pattern and magnitude on mesenchymal transformation and invasion of aortic valve endothelial cells.Biotechnol Bioeng. 2014 Nov;111(11):2326-37. doi: 10.1002/bit.25291. Epub 2014 Aug 5. Biotechnol Bioeng. 2014. PMID: 24898772 Free PMC article.
-
Fluid-structure interaction modeling of compliant aortic valves using the lattice Boltzmann CFD and FEM methods.Biomech Model Mechanobiol. 2023 Jun;22(3):837-850. doi: 10.1007/s10237-022-01684-0. Epub 2023 Feb 10. Biomech Model Mechanobiol. 2023. PMID: 36763197 Free PMC article.
-
Development of Tissue Engineered Heart Valves for Percutaneous Transcatheter Delivery in a Fetal Ovine Model.JACC Basic Transl Sci. 2020 Jul 29;5(8):815-828. doi: 10.1016/j.jacbts.2020.06.009. eCollection 2020 Aug. JACC Basic Transl Sci. 2020. PMID: 32875171 Free PMC article.
References
-
- Balachandran K, Sucosky P, Jo H, Yoganathan AP. Elevated cyclic stretch alters matrix remodeling in aortic valve cusps: implications for degenerative aortic valve disease. Am J Physiol Heart Circ Physiol. 2009;296(3):H756–H764. - PubMed
-
- Bellhouse BJ, Reid KG. Fluid mechanics of the aortic valve. Br Heart J. 1969;31(3):391. - PubMed
-
- Butcher JT, Tressel S, Johnson T, Turner D, Sorescu G, Jo H, Nerem RM. Transcriptional profiles of valvular and vascular endothelial cells reveal phenotypic differences: influence of shear stress. Arterioscler Thromb Vasc Biol. 2006;26(1):69–77. - PubMed
-
- Carmody CJ, Burriesci G, Howard IC, Patterson EA. An approach to the simulation of fluid-structure interaction in the aortic valve. J Biomech. 2006;39(1):158–169. - PubMed
-
- Cerny L, Walawender W. The flow of a viscous liquid in a converging tube. Bull Math Biol. 1966;28(1):11–24. - PubMed
Publication types
MeSH terms
Grants and funding
LinkOut - more resources
Full Text Sources
