. 2011 Jun;240(6):1537-47.
doi: 10.1002/dvdy.22616. Epub 2011 Apr 4.

Detection of isoform-specific fibroblast growth factor receptors by whole-mount in situ hybridization in early chick embryos

Affiliations

Detection of isoform-specific fibroblast growth factor receptors by whole-mount in situ hybridization in early chick embryos

Junko Nishita et al. Dev Dyn. 2011 Jun.

Abstract

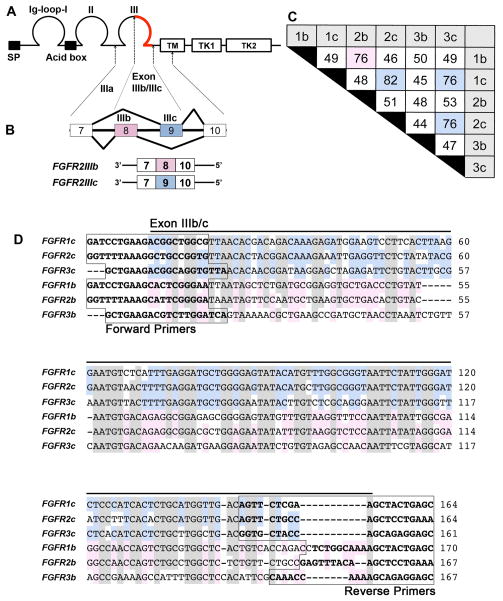
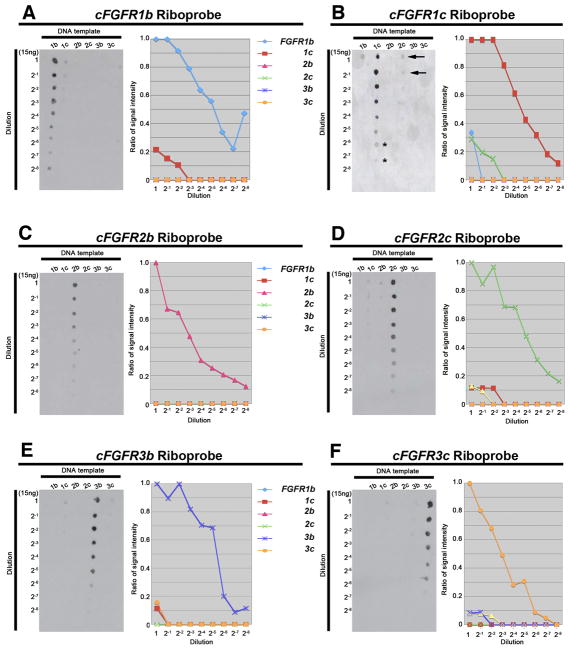
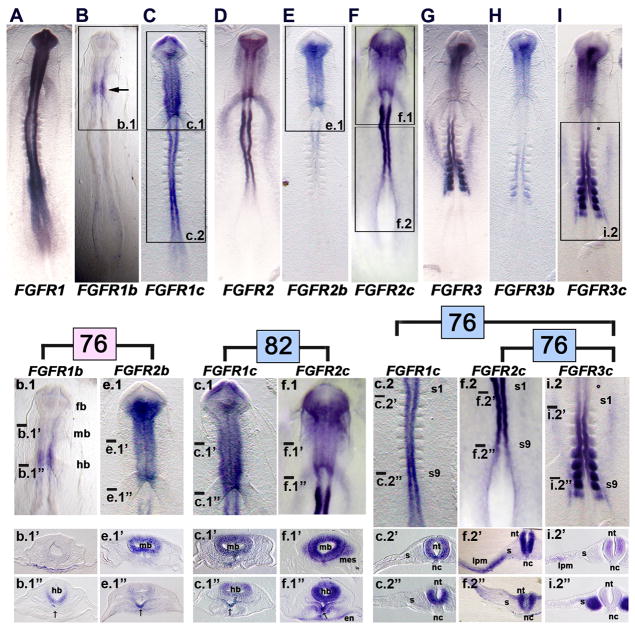
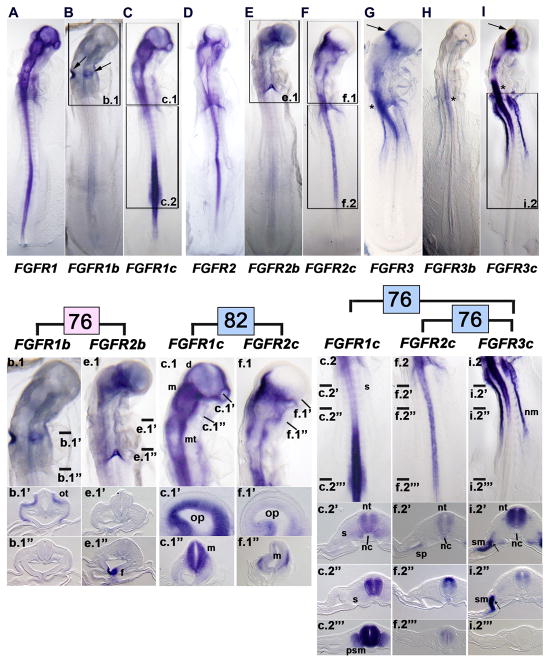
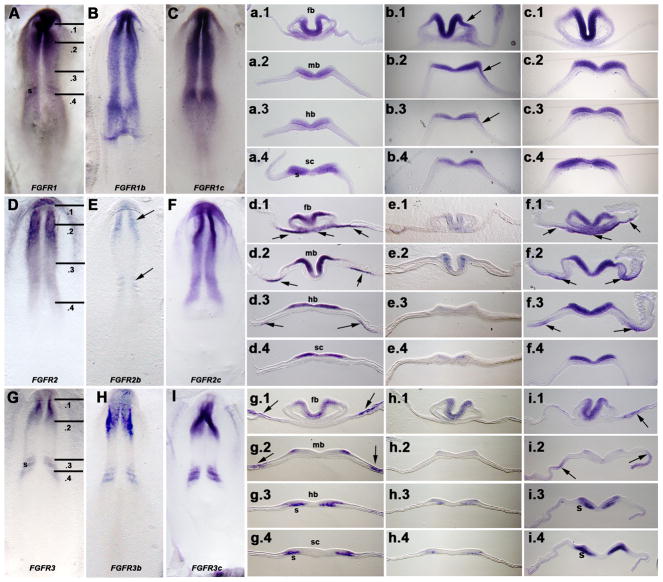
We have developed "b" and "c" isoform-specific chicken fibroblast growth factor (FGF) receptor 1-3 probes for in situ hybridization. We rigorously demonstrate the specificity of these probes by using both dot blot hybridization and whole-mount in situ hybridization during neurulation and early postneurulation stages, and we compare expression patterns of each of the three isoform-specific probes to one another and to generic probes to each of the three (non-isoform-specific) FGF receptors. We show that the expression pattern of each receptor is represented by the collective expression of each of its two isoforms, with the expression of each FGF receptor being most similar to that of its "c" isoform at two of the three stages studied, and that tissue and stage differences exist in the patterns of expression of the six isoforms. We demonstrate the usefulness of these probes for defining the differential tissue expression of FGF receptor 1-3 isoforms.


Figures

Figure 1
Figure 1. The FGF receptor isoforms generated by alternative splicing
A, Diagram of the primary structure of FGF receptors showing a signal peptide (SP), three immunoglobulin-like (Ig) domains (labeled as Ig-loop-I, II, III), a stretch of seven conserved acidic amino acids between IgI and II (Acid box), a single transmembrane domain (TM), and two intracellular tyrosine kinase domains (TK1, 2). B, Alternative splicing of FGF receptors occurs in the IgIII domain, resulting in the corresponding ‘b’ or ‘c’ FGF receptor isoforms. As an example, FGFR2 is diagrammed to show that exons 8 and 9 are alternatively spliced to form the ‘b’ and ‘c’ isoforms. C, The nucleotide identity of the C-terminal half of the IgIII domain of each isoform is tabulated as percent identity, with an identity over 75% being highlighted in pink (isoform ‘b’) or blue (isoform ‘c’). The highest identity occurs between members of isoform ‘c’, with the highest identity of 82% occurring between FGFR1c and FGFR2c. D, The nucleotide sequence alignment of the C-terminal half of the IgIII domain of each isoform. High base pair identity occurs among all six isoforms (shown shaded in gray), with further identity within ‘c’ (blue) and ‘b’ (pink) subgroups. The boxed sequences indicate the location of primers for each isoform.
Figure 2
Figure 2. Dot blot hybridization demonstrates the high specificity of FGF receptor isoform riboprobes
Isoform target DNAs were diluted serially and spotted onto nitrocellulose membranes. Hybridization was performed with a single FGF receptor isoform riboprobe using the same conditions for all riboprobes. A-F, All probes identified their corresponding targets on dot blots (left panel in each figure) with the highest specificity. Faint cross-hybridization can be seen, for example, in the FGFR1c and FGFR2c probe/target interactions (B, arrows), however, the intensity of this cross-hybridization corresponds to a 1:128–256 dilution (2−7, 2−8; asterisks), providing evidence that riboprobes have high specificity for their targets, even in the instance of FGFR1c and FGFR2c, where base pair identity is the highest (82%). The dot blot signal was quantified with ImageJ to produce the graphs (right panel in each figure).
Figure 3
Figure 3. Whole mount in situ hybridization demonstrates the specificity of hybridization of FGF receptor isoform riboprobes in HH stage 9 embryos
A, FGFR1, B, FGFR1b (the boxed area is shown at a higher magnification in b.1; arrow, restricted expression of FGFR1b to the caudal midbrain region), and C, FGFR1c (the boxed areas are shown at a higher magnification in c.1 and c.2) show patterns of expression of FGF receptor 1. b.1, Head region of the FGFR1b labeled embryo shown in B (transverse sections at the craniocaudal levels indicated by the lines are shown in b.1′ and b.1″). c.1, Head region of the FGFR1c labeled embryo shown in C (transverse sections at the craniocaudal levels indicated by the lines are shown in c.1′ and c.1″). c.2, Trunk region of the FGFR1c labeled embryo shown in C (transverse sections at the craniocaudal levels indicated by the lines are shown in c.2′ and c.2″). fb, forebrain; mb, midbrain; hb, hindbrain; s1, somite 1; s9, somite 9; s, somite; nt, neural tube (spinal cord level); nc, notochord; arrows in b.1′ and c.1″ indicate the expression in the ventral midline foregut. D, FGFR2, E, FGFR2b (the boxed area is shown at a higher magnification in e.1), and F, FGFR2c (the boxed areas are shown at a higher magnification in f.1 and f.2) show patterns of expression of FGF receptor 2. e.1, Head region of the FGFR2b labeled embryo shown in E (transverse sections at the craniocaudal levels indicated by the lines are shown in e.1′ and e.1″). f.1, Head region of the FGFR2c labeled embryo shown in F (transverse sections at the craniocaudal levels indicated by the lines are shown in f.1′ and f.1″). f.2, Trunk region of the FGFR2c labeled embryo shown in F (transverse sections at the craniocaudal levels indicated by the lines are shown in f.2′ and f.2″). mb, midbrain; hb, hindbrain; en, endoderm; mes, head mesenchyme; en, endoderm of the anterior intestinal portal; lpm, lateral plate mesoderm; s, somite; nt, neural tube; nc, notochord; arrows in e.1″ and f.1″ indicate expression in the ventral midline foregut. G, FGFR3, H, FGFR3b, and I, FGFR3c (the boxed area is shown at a higher magnification in i.2) show patterns of expression of FGF receptor 3. i.2, Trunk region of the FGFR3c labeled embryo shown in I (transverse sections at the craniocaudal levels indicated by the lines are shown in i.2′ and i.2″). s1, somite 1; s9, somite 9; s, somite; lpm, lateral plate mesoderm; nt, neural tube; nc, notochord. Enlargements and sections are arranged to facilitate comparisons of expression patterns across the receptor family membranes that share the highest identity, indicated by the pink and blue numbers (74, 81, 77, and 72), as explained in Fig. 1C. In all combinations, differences occur in the patterns of expression as detailed in the text.
Figure 4
Figure 4. Whole mount in situ hybridization demonstrates the specificity of hybridization of FGF receptor isoform riboprobes in HH stage 13 embryos
A, FGFR1, B, FGFR1b (the boxed area is shown at a higher magnification in b.1; arrows, expression of FGFR1b in the otic cups), and C, FGFR1c (the boxed areas are shown at a higher magnification in c.1 and c.2). b.1, Head region of the FGFR1b labeled embryo shown in B (transverse sections at the craniocaudal levels indicated by the lines are shown in b.1′ and b.1″). c.1, Head region of the FGFR1c labeled embryo shown in C (transverse sections at the craniocaudal levels indicated by the lines are shown in c.1′ and c.1″). c.2, Trunk region of the FGFR1c labeled embryo (transverse sections at the craniocaudal levels indicated by the lines are shown in c.2′, c.2″, and c.2‴). ot, otic cup; d, diencephalon; m, mesencephalon; mt, metaencephalon; op, optic vesicle; s, somite; nt, neural tube (spinal cord level); nc, notochord; psm, presomitic mesoderm (segmental plate mesoderm). D, FGFR2, E, FGFR2b (the boxed area is shown at a higher magnification in e.1), and F, FGFR2c (the boxed areas are shown at a higher magnification in f.1 and f.2). e.1, Head region of the FGFR2b embryo shown in E (transverse sections at the craniocaudal levels indicated by the lines are shown in e.1′ and e.1″). f.1, Head region of the FGFR2c embryo shown in F (transverse sections along the indicated line are shown in f.1′ and f.1″). f.2, Trunk region of the FGFR2c labeled embryo shown in F (transverse sections at the craniocaudal levels indicated by the lines are shown in f.2′, f.2″, and f.2‴). f, expressing ventral midline of foregut (thyroid rudiment); op, optic vesicle; m, mesencephalon; nt, neural tube (spinal cord level); nc, notochord; sp, medial splanchnic mesoderm. G, FGFR3 (arrow, strong expression at the border between the diencephalon and mesencephalon; asterisk, expression within the hindbrain/cranial spinal cord), H, FGFR3b, and I, FGFR3c (the boxed area is shown at a higher magnification in i.2′; arrow, strong expression at the border between the diencephalon and mesencephalon; asterisk, expression within the hindbrain/cranial spinal cord). i.2, Trunk region of the FGFR3c labeled embryo (transverse sections at the craniocaudal levels indicated by the lines are shown in i.2′, i.2″, and i.2‴). nm, nephrogenic mesoderm (nephrotome or intermediate mesoderm); nt, neural tube (spinal cord level); nc, notochord; sm, somatic mesoderm; arrows in i.2′ and i.2″ indicate nephrogenic mesoderm Enlargements and sections are arranged to facilitate comparisons of expression patterns across the receptor family membranes that share the highest identity, indicated by the pink and blue numbers (74, 81, 77, and 72), as explained in Fig. 1C. In all combinations, differences occur in the patterns of expression as detailed in the text.
Figure 5
Figure 5. Whole mount in situ hybridization demonstrates similarity in the patterns of expression of FGF receptor isoforms in HH stage 7 embryos
A, FGFR1, B, FGFR1b, and C, FGFR1c. Lines in A indicate section planes shown in a.1-a.4, b.1-b.4, and c.1-c.4. fb, forebrain level; mb, midbrain level; hb, hindbrain level; sc, spinal cord level. Arrow in b.3 indicates expression in the ectoderm of the future otic placode, which extends cranially to flank both the midbrain (b.2, arrow) and forebrain (b.1, arrow) levels. D, FGFR2, E, FGFR2b (weak expression restricted to the cranial and caudal levels of neuraxis), and F, FGFR2c. Lines in D indicate section planes shown in d.1-d.4, e.1-e.4, and f.1-f.4. fb, forebrain level; mb, midbrain level; hb, hindbrain level; sc, spinal cord level. Arrows in d.1, d.2, d.3, f1, f.2, and f.3 indicate expressing areas of endoderm (and in some regions, also overlying tissue). G, FGFR3, H, FGFR3b, and I, FGFR3c. Lines in G indicate section planes shown in g.1-g.4, h.1-h.4, and i.1-i.4. fb, forebrain level; mb, midbrain level; hb, hindbrain level; sc, spinal cord level; s, somite. Arrows in g.1, g.2, i1 and i.2 indicate expressing areas of ectoderm and/or underlying lateral plate mesoderm.

Similar articles

Cited by

References

    1. Bell GW, Yatskievych TA, Antin PB. GEISHA, a whole-mount in situ hybridization gene expression screen in chicken embryos. Dev Dyn. 2004;229:677–687. - PubMed
    1. Böttcher RT, Niehrs C. Fibroblast growth factor signaling during early vertebrate development. Endocr Rev. 2005;26:63–77. - PubMed
    1. Burt DW, Carrë W, Fell M, Law AS, Antin PB, Maglott DR, Weber JA, Schmidt CJ, Burgess SC, McCarthy FM. The Chicken Gene Nomenclature Committee report. BMC Genomics. 2009;10(Suppl 2):S5. - PMC - PubMed
    1. Chapman SC, Schubert FR, Schoenwolf GC, Lumsden A. Analysis of spatial and temporal gene expression patterns in blastula and gastrula stage chick embryos. Dev Biol. 2002;245:187–199. - PubMed
    1. Darnell DK, Kaur S, Stanislaw S, Davey S, Konieczka JH, Yatskievych TA, Antin PB. GEISHA: an in situ hybridization gene expression resource for the chicken embryo. Cytogenet Genome Res. 2007;117:30–35. - PubMed

Publication types

MeSH terms

Substances

LinkOut - more resources