Comparative Study
. 2012 Jan;155(1):143-50.
doi: 10.1016/j.cbpc.2011.03.011. Epub 2011 Apr 3.

Comparative cytotoxicity and genotoxicity of particulate and soluble hexavalent chromium in human and sperm whale (Physeter macrocephalus) skin cells

Affiliations
Comparative Study

Comparative cytotoxicity and genotoxicity of particulate and soluble hexavalent chromium in human and sperm whale (Physeter macrocephalus) skin cells

Tânia Li Chen et al. Comp Biochem Physiol C Toxicol Pharmacol. 2012 Jan.

Abstract

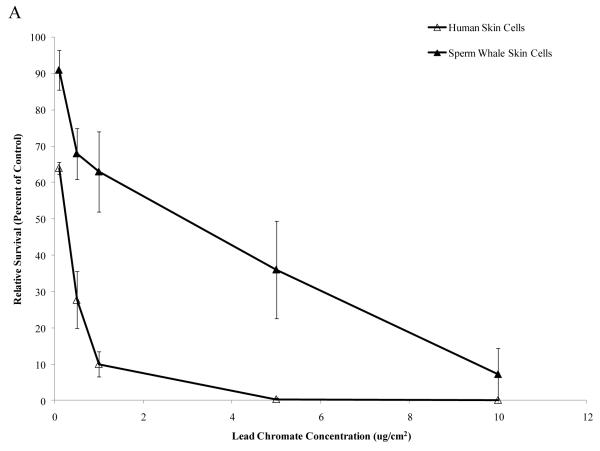
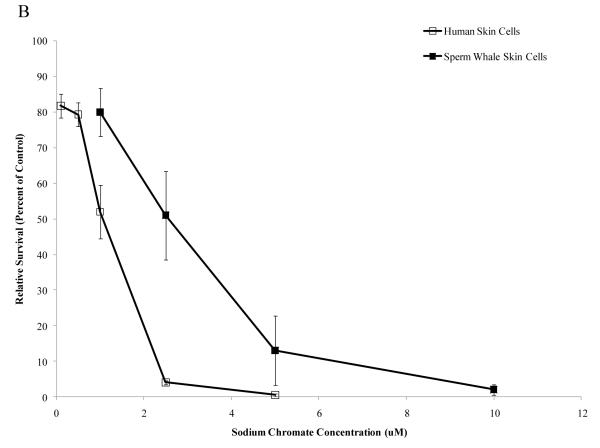
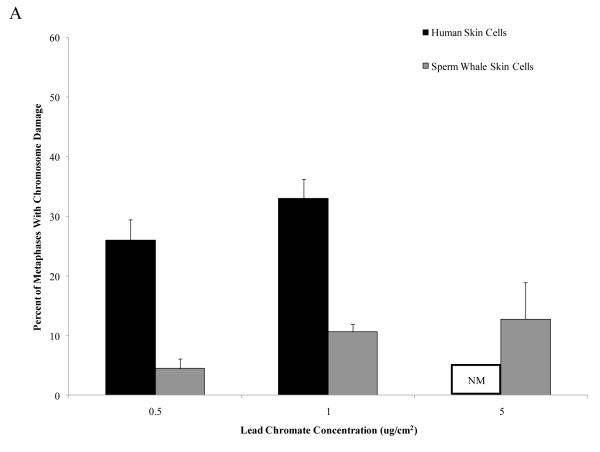
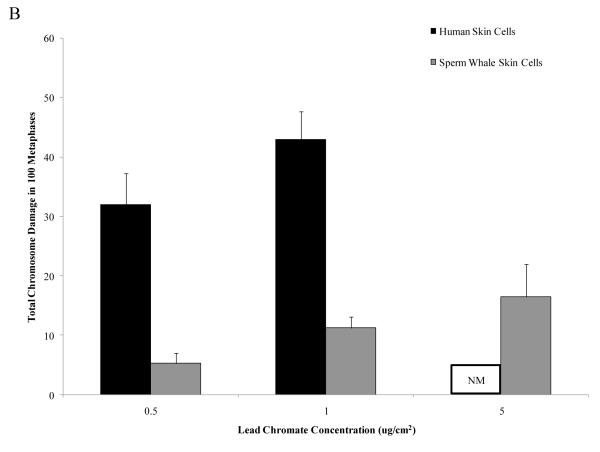
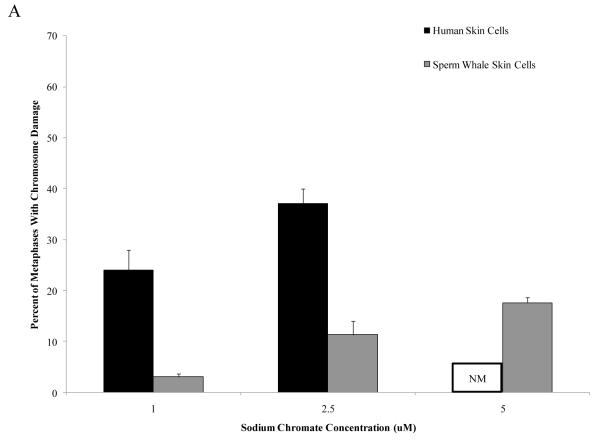
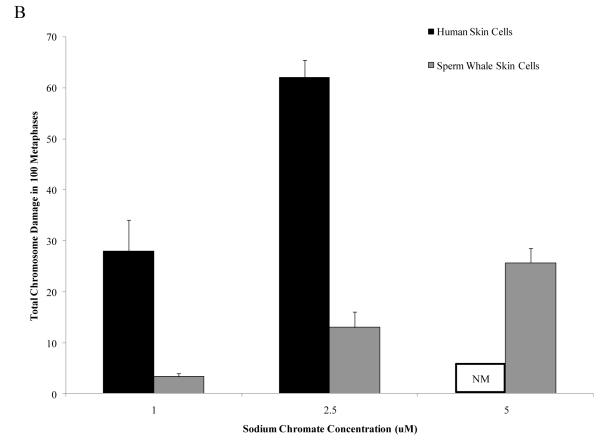
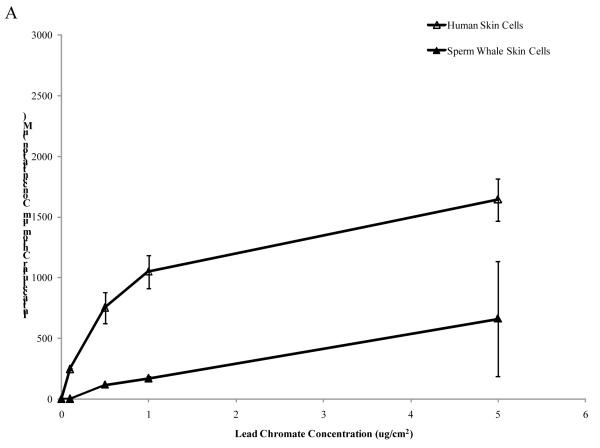
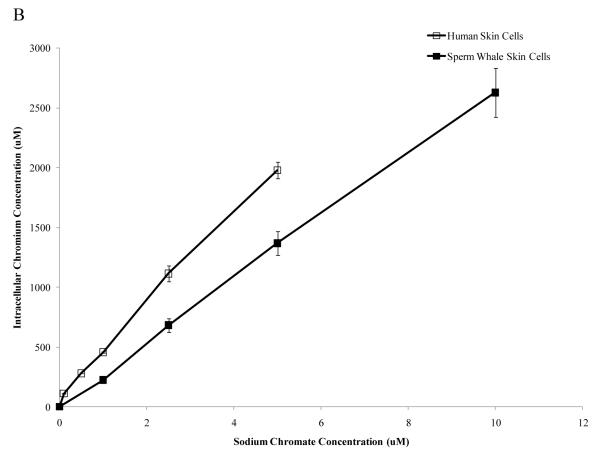
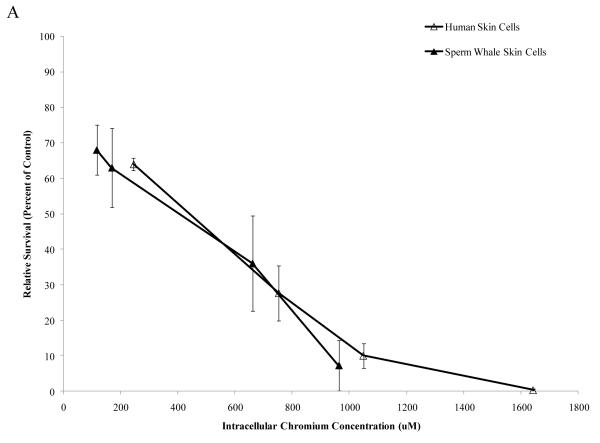
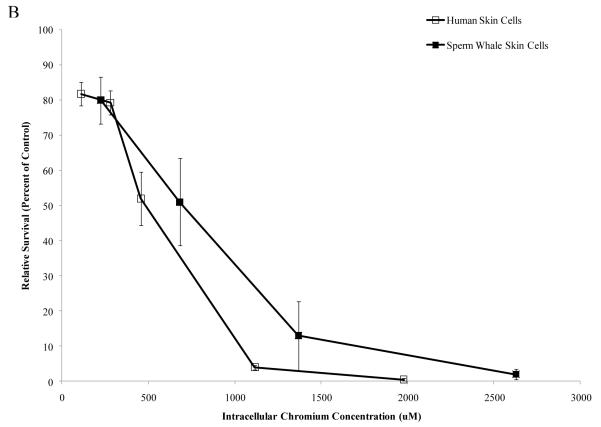
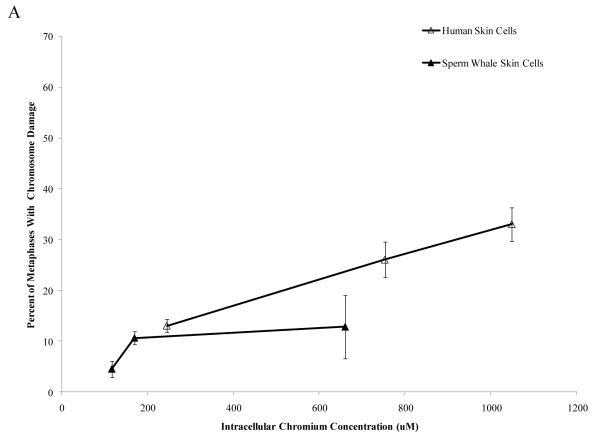
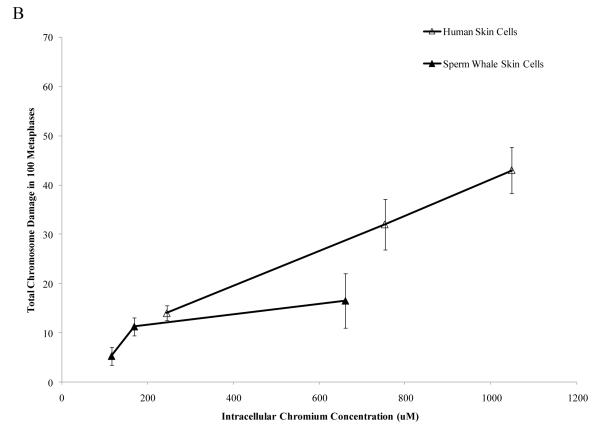
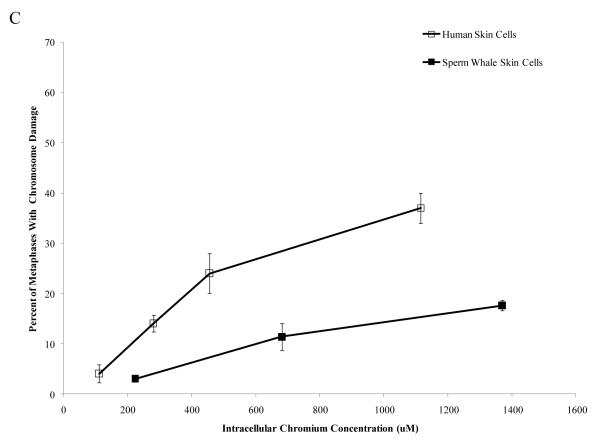
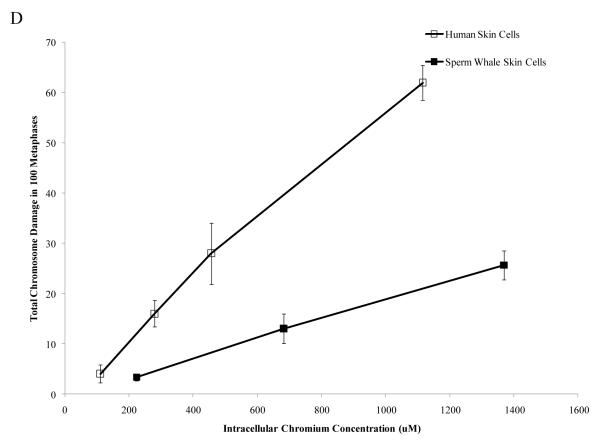
Chromium (Cr) is a global marine pollutant, present in marine mammal tissues. Hexavalent chromium [Cr(VI)] is a known human carcinogen. In this study, we compare the cytotoxic and clastogenic effects of Cr(VI) in human (Homo sapiens) and sperm whale (Physeter macrocephalus) skin fibroblasts. Our data show that increasing concentrations of both particulate and soluble Cr(VI) induce increasing amounts of cytotoxicity and clastogenicity in human and sperm whale skin cells. Furthermore, the data show that sperm whale cells are resistant to these effects exhibiting less cytotoxicity and genotoxicity than the human cells. Differences in Cr uptake accounted for some but not all of the differences in particulate and soluble Cr(VI) genotoxicity, although it did explain the differences in particulate Cr(VI) cytotoxicity. Altogether, the data indicate that Cr(VI) is a genotoxic threat to whales, but also suggest that whales have evolved cellular mechanisms to protect them against the genotoxicity of environmental agents such as Cr(VI).


Figures

Figure 1
Figure 1. Sperm Whale Skin Cells Are More Resistant to Cr(VI) Cytotoxicity than Human Skin Cells
This figure shows that exposure to Cr(VI) induces cytotoxicity in human and sperm whale skin cells in a concentration-dependent manner. (A) Particulate Cr(VI) cytotoxicity in human and sperm whale skin cells. Significant differences between the two cell lines were observed (difference between sperm whale and human skin cells at 1 μg /cm2 was 40.5% based on the fitted values; CI=27.9% to 53.1%; p<0.001). (B) Soluble Cr(VI) cytotoxicity in human and sperm whale skin cells. Significant differences between the two cell lines were observed (difference between sperm whale and human skin cells at 1 μM was 20.5% based on the fitted values; CI=8.2% to 32.8%; p<0.001). Data represent the average of 3 independent experiments. Error bars = standard error of the mean.
Figure 2
Figure 2. Sperm Whale Skin Cells Are More Resistant to Particulate Cr(VI) Clastogenicity than Human Skin
This figure shows that exposure to particulate Cr(VI) induces clastogenicity in human and sperm whale skin cells in a concentration-dependent manner. Clastogenicity is presented as a percent of metaphases with chromosome damage and total chromosome damage in 100 metaphases for each cell line. (A) Particulate Cr(VI)-induced percent of metaphases with chromosome damage. Significant differences between the two cell lines were observed (difference between sperm whale and human skin cells for percent of metaphases with damage at 1 μg /cm2 was −22.7% based on the fitted values; CI = −17.0% to −28.3%; p<0.001). Untreated control values were subtracted from each concentration. The percent metaphases with damage for untreated controls was 2% for both sperm whale and human cells. (B) Particulate Cr(VI)-induced total chromosome damage in 100 metaphase. Significant differences between the two cell lines were observed (difference for total damage in 100 metaphases at 1 μg /cm2 was −31.4 based on the fitted values; CI= −25.2 to −37.7; p<0.001.). Untreated control values were subtracted from each concentration. The total damage in 100 metaphases for untreated controls was 2 for sperm whale cells and 3 for human cells. Data represent the average of at least 3 independent experiments. Error bars = standard error of the mean. NM – no metaphases observed.
Figure 3
Figure 3. Sperm Whale Skin Cells Are More Resistant to Soluble Cr(VI) Clastogenicity than Human Skin
This figure shows that exposure to soluble Cr(VI) induces clastogenicity in human and sperm whale skin cells in a concentration-dependent manner. Clastogenicity was measured as a percent of metaphases with chromosome damage and total chromosome damage in 100 metaphases for each cell line. (A) Soluble Cr(VI)-induced percent of metaphases with chromosome damage. Significant differences between the two cell lines were observed (difference between sperm whale and human skin cells for percent of metaphases with damage at 1 μM was −20.2% based on the fitted values; CI= −16.7% to −23.7%; p<0.001). Untreated control values were subtracted from each concentration. The percent metaphases with damage for untreated controls was 2% for sperm whale cells and 4% for human cells. (B) Soluble Cr(VI)-induced total chromosome damage in 100 metaphases. Significant differences between the two cell lines were observed (difference for total damage in 100 metaphases at 1 μM was −24.3 based on the fitted values; CI= −19.4 to −29.2; p<0.001). Untreated control values were subtracted from each concentration. The total damage in 100 metaphases for untreated controls was 2 for sperm whale cells and 4 for human cells. Data represent the average of at least 3 independent experiments. Error bars = standard error of the mean. NM – no metaphases observed.
Figure 4
Figure 4. Sperm Whale Skin Cells Take Up Less Cr than Human Skin Cells
This figure shows that after exposure to Cr(VI) human and sperm whale skin cells take up Cr in a concentration-dependent manner. (A) Cr uptake after particulate Cr(VI) treatment. Significant differences between the two cell lines were observed (linear component of the relationship between administered dose and intracellular concentration was 275 μM less per μg /cm2 for sperm whale cells than for human cells; CI = 153 to 397; p<0.001). (B) Cr uptake after soluble CrVI) treatment. Significant differences between the two cell lines were observed (linear component of the relationship between administered dose and intracellular concentration was 235 μM less per μM for sperm whale cells than for human cells; CI = 134 to 337; p<0.001). Data represent the average of 3 independent experiments. Error bars = standard error of the mean.
Figure 5
Figure 5. Differences in Cr Uptake Explain the Resistance of Whale Cells to Particulate Cr(VI) Cytotoxicity but Not Soluble Cr(VI) Cytotoxicity
This figure shows that Cr(VI) induced cytotoxicity in human and sperm whale skin cells as a function of intracellular Cr concentration. In accordance with the majority of the published Cr(VI) literature, treatments with particulate Cr(VI) are presented in μg /cm2 and treatments with soluble Cr(VI) in μM. These units reflect that fact that the lead chromate particles only partially dissolve while the sodium chromate fully dissolves. Thus, these chemicals cannot accurately be compared based on administered dose. Lead chromate treatment concentrations of 0.1, 0.5, 1, 5 and 10 μg /cm2 correspond to 0.068, 0.34, 0.68, 3.4 and 6.8 μg Cr/mL, respectively. Sodium chromate treatment concentrations of 0.1, 0.5, 1, 2.5, 5 and 10 μM correspond to 0.005, 0.026, 0.05, 0.13, 0.26 and 0.5 μg Cr/mL, respectively. (A) Particulate Cr(VI)-induced cytotoxicity in human and sperm whale skin cells based on intracellular Cr levels. Significant differences between the two cell lines were not observed (difference between sperm whale and human cells in survival at 400 μM was 3.1% based on fitted values; CI = −12.1% to 18.2%; p = 0.69). (B) Soluble Cr(VI)-induced cytotoxicity in human and sperm whale skin cells based on intracellular Cr levels. Significant differences between the two cell lines were observed (difference between sperm whale and human cells in survival at 800 μM was 21.7% based on fitted values; CI = 10.4% to 33.1%; p<0.001. The difference between these effects for the particulate versus the soluble was statistically reliable p = 0.01). Data represent the average of 3 independent experiments. Error bars = standard error of the mean.
Figure 6
Figure 6. Differences in Cr Uptake Cannot Explain the Resistance of Whale Cells to Cr(VI) Clastogenicity
This figure shows that exposure to Cr(VI) induces clastogenicity in human and sperm whale skin cells as a function of intracellular Cr concentration. Clastogenicity is presented as a percent of metaphases with chromosome damage and total chromosome damage in 100 metaphases for each cell line. (A) Particulate Cr(VI)-induced percent metaphases with chromosome damage as a function of intracellular Cr concentration. Significant differences between the two cell lines were observed (difference in percent of metaphase with damage for the particulate form at 800 μM was −31.3%; CI = −9.2% to −53.4%; p=0.006). Untreated control values were subtracted from each concentration. The percent metaphases with damage for untreated controls was 2% for both sperm whale and human cells. (B) Particulate Cr(VI)-induced total chromosome damage in 100 metaphases as a function of intracellular Cr concentration. Significant differences between the two cell lines were observed (difference in total damage for the particulate form at 800 μM was −32.3; CI = −6.9 to −57.8; p = 0.01). Untreated control values were subtracted from each concentration. The total damage in 100 metaphases for untreated controls was 2 for sperm whale cells and 3 for human cells. (C) Soluble Cr(VI)-induced percent metaphases with chromosome damage as a function of intracellular Cr concentration. Significant differences between the two cell lines were observed (difference in percent of metaphase with damage for the soluble form at 800 μM was −21.3%; CI = −17.0% to −25.6%; p<0.001). Untreated control values were subtracted from each concentration. The percent metaphases with damage for untreated controls was 2% for sperm whale cells and 4% for human cells. (D) Soluble Cr(VI)-induced total chromosome damage in 100 metaphases as a function on intracellular Cr concentration. Significant differences between the two cell lines were observed (difference in total damage for the soluble form at 800 μM was −31.6; CI = −25.7 to −37.4; p<0.001). Untreated control values were subtracted from each concentration. The total damage in 100 metaphases for untreated controls was 2 for sperm whale cells and 4 for human cells. Data represent the average of at least 3 independent experiments. Error bars = standard error of the mean.

Similar articles

Cited by

References

    1. Agency for Toxic Substances and Disease Registry (ATSDR) Toxicological profile for Chromium. U.S. Department of Health and Human Services, Public Health Service, Agency for Toxic Substances and Disease Registry; Atlanta, GA: 2008.
    1. Bodannes RS, Chan PC. Ascorbic acid as a scavenger of singlet oxygen. FEBS Lett. 1979;105:195–196. - PubMed
    1. Geisler CD, Schmidt D. An overview of chromium in the marine environment. Dt. Hydrogr. Z. 1991;44:185–196.
    1. Holmes AL, Wise SS, Xie H, Gordon N, Thompson WD, Wise JP., Sr. Lead ions do not cause human lung cells to escape chromate-induced cytotoxicity. Toxicol. Appl. Pharmacol. 2005;203:167–176. - PubMed
    1. Kaczmarek M, Timofeeva OA, Karaczyn A, Malyguine A, Kasprzak KS, Salnikow K. The role of ascorbate in the modulation of HIF-1alpha protein and HIF-dependent transcription by chromium(VI) and nickel(II) Free Radic. Biol. Med. 2007;42:1246–57. - PMC - PubMed

Publication types

LinkOut - more resources