. 2011 Jun 3;286(22):19270-9.
doi: 10.1074/jbc.M110.200311. Epub 2011 Apr 5.

Negative regulation of STAT3 protein-mediated cellular respiration by SIRT1 protein

Affiliations

Negative regulation of STAT3 protein-mediated cellular respiration by SIRT1 protein

Michel Bernier et al. J Biol Chem. .

Abstract

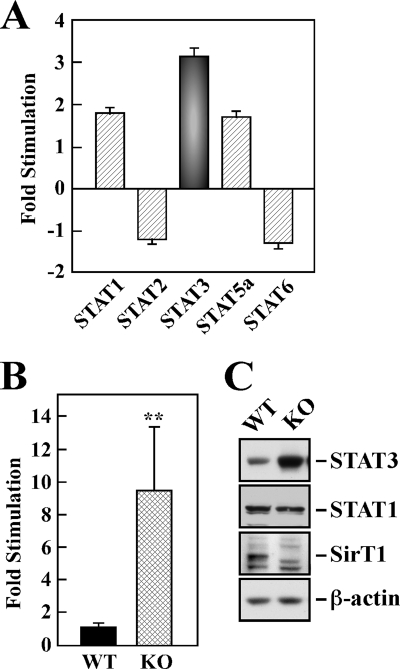
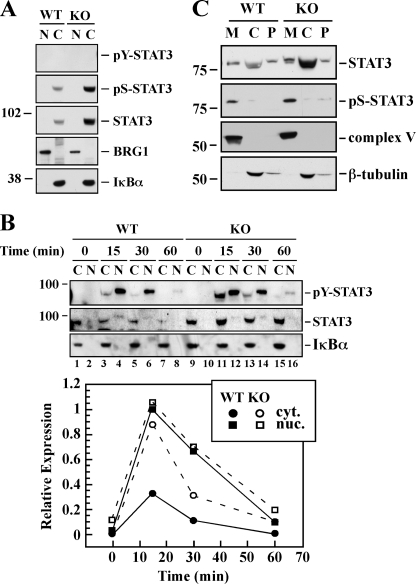
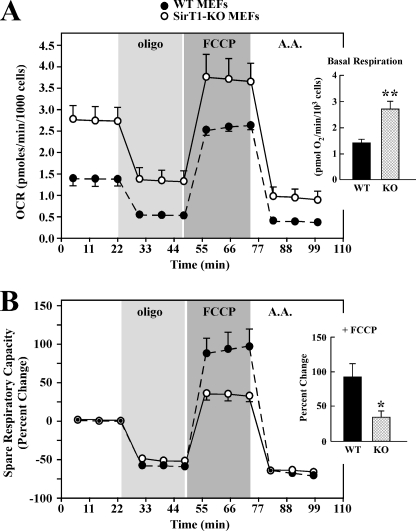
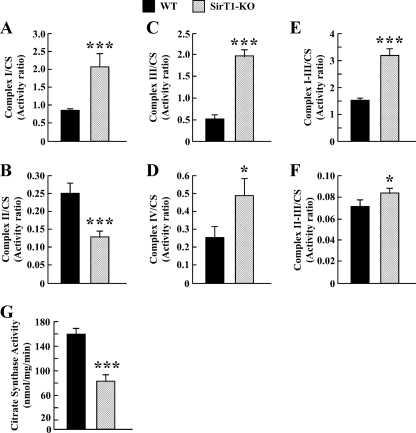
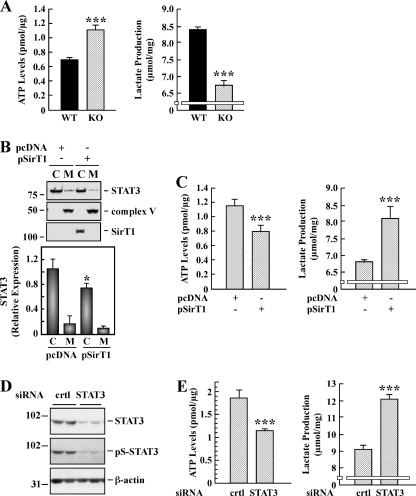
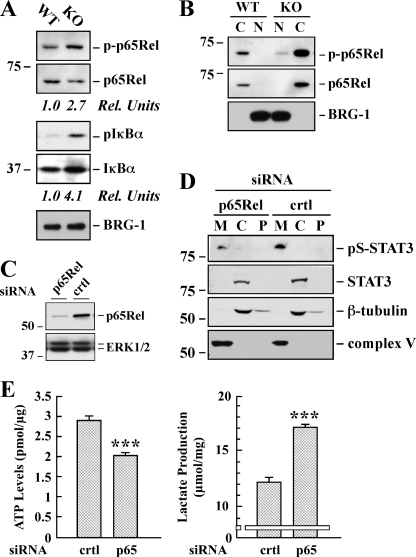
In mammals, the transcriptional activity of signal transducer and activator of transcription 3 (STAT3) is regulated by the deacetylase SIRT1. However, whether the newly described nongenomic actions of STAT3 toward mitochondrial oxidative phosphorylation are dependent on SIRT1 is unclear. In this study, Sirt1 gene knock-out murine embryonic fibroblast (MEF) cells were used to delineate the role of SIRT1 in the regulation of STAT3 mitochondrial function. Here, we show that STAT3 mRNA and protein levels and the accumulation of serine-phosphorylated STAT3 in mitochondria were increased significantly in Sirt1-KO cells as compared with wild-type MEFs. Various mitochondrial bioenergetic parameters, such as the oxygen consumption rate in cell cultures, enzyme activities of the electron transport chain complexes in isolated mitochondria, and production of ATP and lactate, indicated that Sirt1-KO cells exhibited higher mitochondrial respiration as compared with wild-type MEFs. Two independent approaches, including ectopic expression of SIRT1 and siRNA-mediated knockdown of STAT3, led to reduction in intracellular ATP levels and increased lactate production in Sirt1-KO cells that were approaching those of wild-type controls. Comparison of profiles of phospho-antibody array data indicated that the deletion of SirT1 was accompanied by constitutive activation of the pro-inflammatory NF-κB pathway, which is key for STAT3 induction and increased cellular respiration in Sirt1-KO cells. Thus, SIRT1 appears to be a functional regulator of NF-κB-dependent STAT3 expression that induces mitochondrial biogenesis. These results have implications for understanding the interplay between STAT3 and SIRT1 in pro-inflammatory conditions.


Figures

FIGURE 1.
FIGURE 1.
Up-regulated expression of STAT3 in SirT1-KO MEF cells. A, cDNA microarray expression data from wild-type (WT) and Sirt1-KO (KO) MEF cells. The bars indicate the relative abundance of STAT1, STAT2, STAT3, STAT5a, and STAT6 (ratio of the signal intensities of KO cells relative to WT cells) and are represented as average ± S.D. B, relative mRNA expression of STAT3 was assessed by quantitative PCR, and the values were normalized to GAPDH mRNA levels. The data represent the average ± S.D. of three independent experiments. **, p < 0.01 versus WT group. C, cellular expression of STAT3, STAT1, and SIRT1 proteins was assessed by Western blot analysis. Blot was reprobed for β-actin, which was used as a loading control.
FIGURE 2.
FIGURE 2.
Subcellular distribution of STAT3. The WT and Sirt1-KO MEFs were incubated in the absence (A) or presence (B) of 20 ng/ml murine OSM for 15, 30, and 60 min. Nuclear (N) and cytosolic (C) fractions were prepared and processed for Western blot analysis using antibodies specific for phosphotyrosine (pY), phosphoserine (pS), and unphosphorylated/total forms of STAT3. The membranes were reprobed with antibodies specific for the nuclear marker BRG-1 and the cytoplasmic IκBα. The relative subcellular distribution of Tyr(P)-STAT3 levels in response to OSM treatment was determined by densitometry. Similar results were obtained in a second independent experiment. C, cytosolic (C), mitochondrial (M) and P100 membrane (P) fractions from the WT and Sirt1-KO MEFs were processed for the detection of Ser(P)-STAT3 and STAT3 by Western blot. The membranes were reprobed with the mitochondrial marker complex V and the cytosolic marker β-tubulin. The migration of molecular mass markers (values in kilodaltons) is shown on the left of immunoblots.
FIGURE 3.
FIGURE 3.
SirT1-KO MEF cells exhibit increased basal mitochondrial respiration. Eighteen h after plating, WT and Sirt1-KO MEFs were incubated in unbuffered XF assay media in ambient air for 1 h. OCR was determined using Seahorse XF-24 metabolic flux analyzer. A, OCRs from WT cells (black) have lower basal rates of mitochondrial respiration than Sirt1-KO MEFs (open symbols). Vertical lines indicate time of addition of mitochondrial inhibitors (i) oligomycin (1 μm), (ii) FCCP (0.3 μm), or (iii) antimycin A (A.A.) (2 μm). The maximal respiratory capacity (FCCP) is significantly lower in WT than Sirt1-KO cells. Inset, average basal respiration between WT and Sirt1-KO cells. Data represent the average ± S.D. of five independent experiments. B, percent change in spare respiratory capacity in response to mitochondrial inhibitors. Spare respiratory capacity is significantly higher in WT than Sirt1-KO cells (*, p < 0.05 as compared with WT group; n = 5). Inset, average values of the spare respiratory capacity of the WT and Sirt1-KO cells after exposure to FCCP. Data represents the average ± S.D. of five independent experiments. * and **, p < 0.05 and 0.01 as compared with WT groups.
FIGURE 4.
FIGURE 4.
Enzyme activities of the mitochondrial electron transport chain complexes. Enzymatic activities of complex I (A), complex II (B), complex III (C), complex IV (D), complex I plus III (E), and complex II plus III (F) were measured in isolated mitochondria from WT (black bars) and Sirt1-KO MEFs (hatched bars) as described under “Experimental Procedures.” Values are expressed as activity ratio, whereby nanomoles of substrate (donor or acceptor) consumed by min per mg of protein were normalized to the mitochondrial CS activity (G). The data represent the average ± S.D. of three independent experiments. * and ***, p < 0.05 and 0.001 versus WT groups.
FIGURE 5.
FIGURE 5.
Effect of SIRT1 and STAT3 on intracellular ATP levels and lactate production. A, WT and Sirt1-KO MEFs were processed for the determination of intracellular ATP (left panel) and lactate production (right panel). Bars represent the average ± S.D. of three independent experiments. B, Sirt1-KO MEF cells were transfected with pcDNA control and SIRT1 expressing plasmid for 48 h followed by isolation of mitochondrial (M) and cytosolic (C) fractions. Representative Western blot shows the signal associated with STAT3, complex V, and SIRT1. Bars represent the average ± S.D. (n = 3). *, p < 0.05 versus pcDNA. C, Sirt1-KO MEF cells were transiently transfected as in B and processed for the determination of intracellular ATP (left panel) and lactate production (right panel). Bars represent the average ± S.D. of two independent experiments performed in triplicate dishes. D, Sirt1-KO MEF cells were transfected with 40 nm of control (crtl) and STAT3 siRNAs. Following 48 h of siRNA knockdown, cells were subjected to Western blot analysis for STAT3 and Ser(P)-STAT3 (pS-STAT3) expression levels. The blot was reprobed with anti-β-actin as a loading control. The migration of molecular mass markers (values in kilodaltons) is shown on the left of immunoblots. E, control and STAT3-depleted Sirt1-KO cells were processed for the determination of intracellular ATP (left panel) and lactate production (right panel). Bars represent the average ± S.D. of two independent experiments performed in triplicate. ***, p < 0.001 versus WT or control cells.
FIGURE 6.
FIGURE 6.
Effect of p65Rel silencing on STAT3 expression and ATP/lactate ratio in SirT1-KO MEFs. A, total lysates of WT and Sirt1-KO MEFs were prepared and analyzed by Western blot for total and phosphorylated p65Rel, as well as total and phosphorylated IκBα. The blot was reprobed for BRG1 as a loading control. Rel Units, for each phospho-specific antibody, a phosphorylation signal ratio change (phospho/total) was calculated and normalized to the WT sample. The migration of molecular-mass markers (values in kilodaltons) is shown on the left of immunoblots. B, cytosolic (C) and nuclear (N) fractions were prepared from the WT and Sirt1-KO MEFs and processed for immunoblot analysis. The blot was reprobed with anti-BRG1 antibody to demonstrate the quality of our nuclear fractionation. C, Sirt1-KO MEFs were transfected with 40 nm of either control (crtl) or a pool of four siRNAs targeting p65Rel. Following 48 h of siRNA knockdown, cell lysates were subjected to Western blot analysis for p65Rel and ERK1/2 expression levels. D, mitochondrial (M), cytosolic (C), and P100 membrane (P) fractions were prepared from Sirt1-null MEFs transfected with either control or p65-Rel siRNA. Western blot analysis was performed with the indicated antibodies. Similar results were obtained in two independent experiments performed in triplicate dishes. Ser(P)-STAT3 (pS-STAT3). E, control and p65Rel-depleted Sirt1-KO cells were processed for lactate determination and ATP levels. The data represents the average ± S.D. of three independent experiments. ***, p < 0.001 versus control siRNA-transfected cells.

Similar articles

Cited by

References

    1. Haigis M. C., Sinclair D. A. (2010) Annu. Rev. Pathol. 5, 253–295 - PMC - PubMed
    1. Gorospe M., de Cabo R. (2008) Trends Cell Biol. 18, 77–83 - PMC - PubMed
    1. Vaquero A., Reinberg D. (2009) Genes Dev. 23, 1849–1869 - PMC - PubMed
    1. Michan S., Sinclair D. (2007) Biochem. J. 404, 1–13 - PMC - PubMed
    1. Cantó C., Auwerx J. (2009) Curr. Opin. Lipidol. 20, 98–105 - PMC - PubMed

Publication types

MeSH terms