. 2011 Jun 3;286(22):20087-99.
doi: 10.1074/jbc.M110.191718. Epub 2011 Apr 5.

Synergistic interactions between heregulin and peroxisome proliferator-activated receptor-gamma (PPARgamma) agonist in breast cancer cells

Affiliations

Synergistic interactions between heregulin and peroxisome proliferator-activated receptor-gamma (PPARgamma) agonist in breast cancer cells

Bae-Hang Park et al. J Biol Chem. .

Abstract

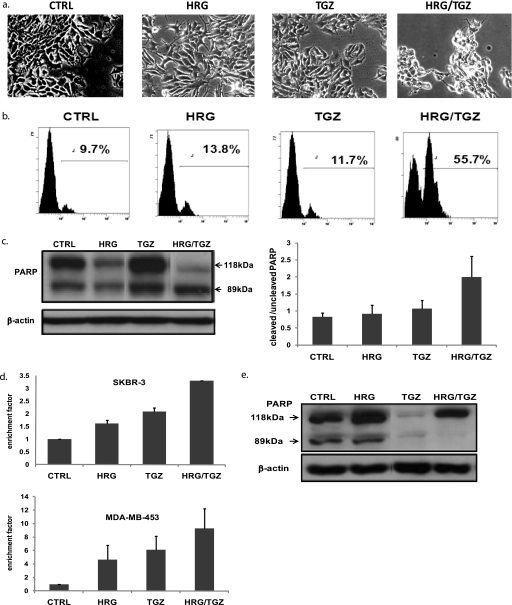
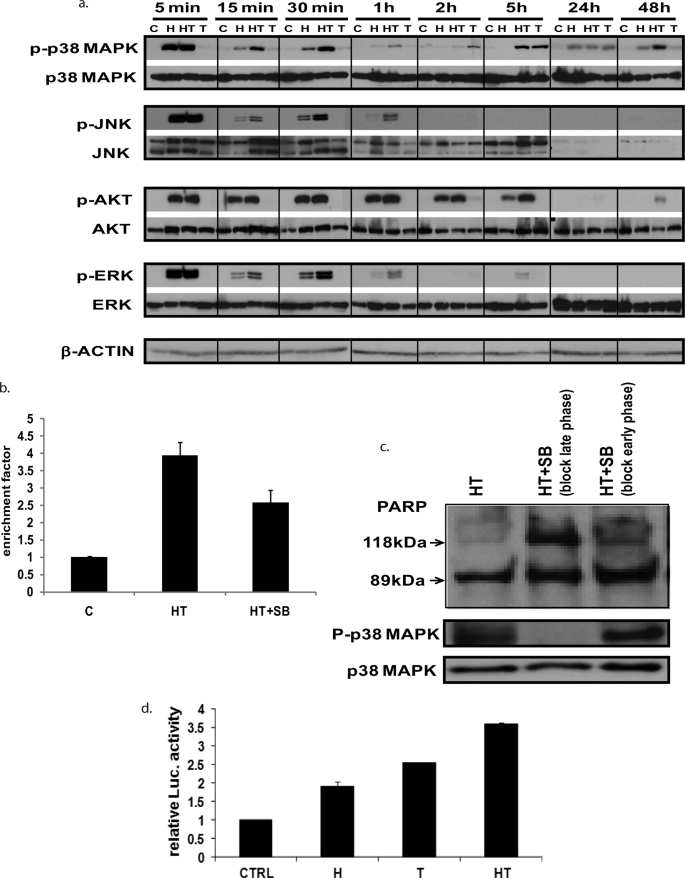
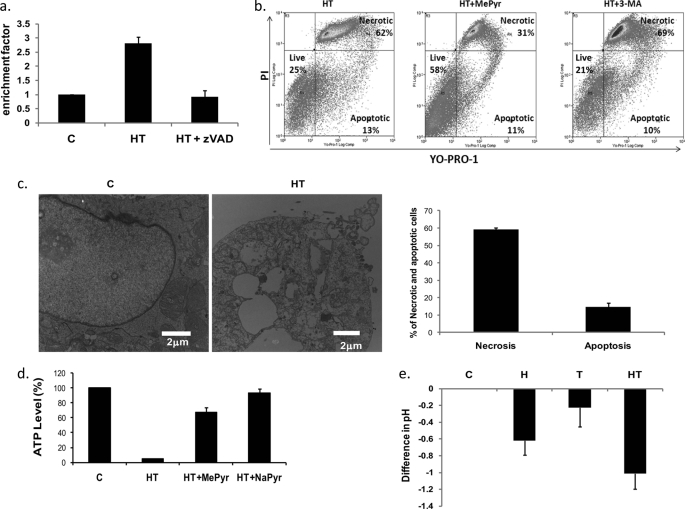
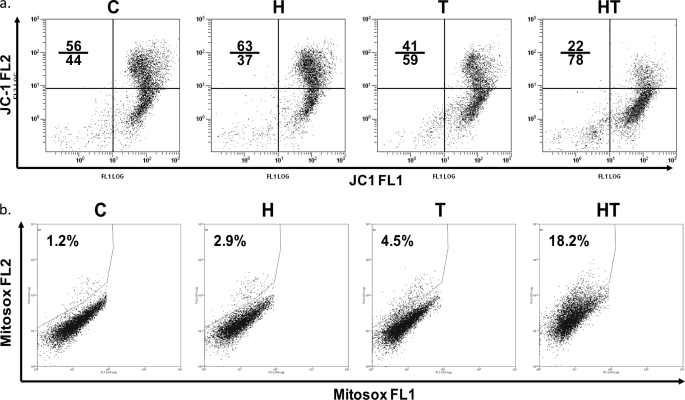
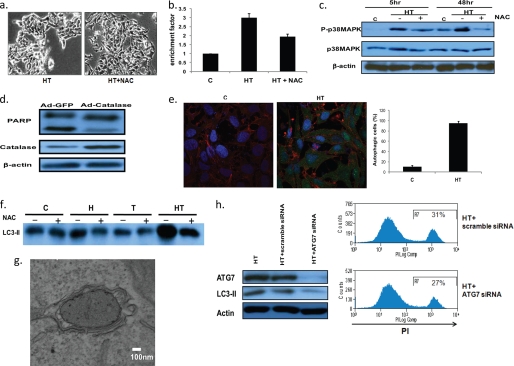
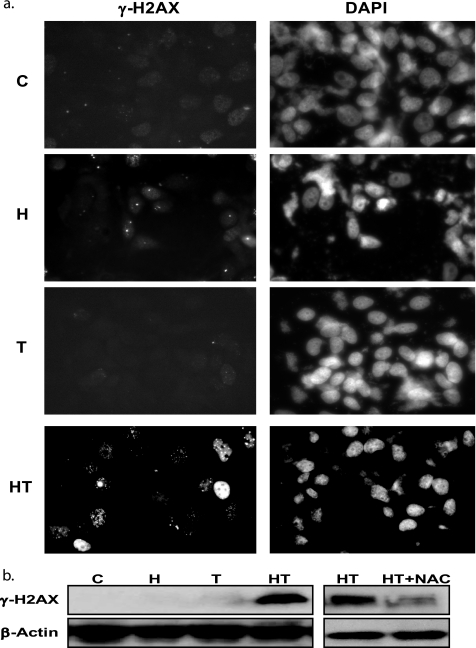
Here, we demonstrate that troglitazone (Rezulin), a peroxisome proliferator-activated receptor agonist, acted in synergy with heregulin to induce massive cell death in breast cancer cells. Although the combination of heregulin and troglitazone (HRG/TGZ) induced both apoptosis and necrosis, the main mode of cell death was caspase-independent and occurred via necrosis. This combination increased generation of superoxide in mitochondria, which in turn destabilized mitochondria potential. Pretreatment with N-acetyl-l-cysteine and catalase expression ameliorated cell death induced by the combination treatment, indicating a role of oxidative stress in mediating HRG/TGZ-induced cell death. Notably, pretreatment with pyruvate significantly prevented the cell death, suggesting a potential mechanistic link between metabolic stress and HRG/TGZ-induced cell death. The activation of the HRG signaling axis has been considered as a poor prognostic factor in breast cancer and confers resistance to gefitinib (Iressa) and tamoxifen. However, our data presented here paradoxically suggest that HRG expression can actually be beneficial when it comes to treating breast cancer with peroxisome proliferator-activated receptor-γ ligands. Taken together, the combination of HRG and TGZ may provide a basis for the development of a novel strategy in the treatment of apoptosis-resistant and/or hormone-refractory breast cancer.


Figures

FIGURE 1.
FIGURE 1.
Combination treatment of HRG and TGZ markedly increases cell death in breast cancer cells. a, MCF-7 cells were treated for 48 h with either 100 ng/ml HRG or 10 μm TGZ alone or with a combination of heregulin and troglitazone (HRG/TGZ). Cell morphology was examined under the phase contrast microscope. b, quantification of cell death was made by PI staining (5 μg/ml). MCF-7 cells were treated for 48 h with either HRG or TGZ alone or with a combination of HRG/TGZ as described. The percentage of PI-positive cells indicates the proportion of cell death. Shown are representatives of at least three independent experiments. c, left panel, after treatment with the indicated compounds for 48 h, cell extracts from MCF-7 cells were prepared and analyzed by Western blotting using anti-PARP antibody. Shown is a representative Western blot of four independent experiments. Right panel, quantitative data expressing the ratio of cleaved to uncleaved PARP. PARP cleavage was quantified by densitometry, normalized to β-actin, and calculated as a ratio of cleaved PARP to uncleaved PARP. The data are expressed as the means ± S.E. CTRL, control. d, cells (SKBR-3 and MDA-MB-453) were treated as described in the legend to a. Cell death detection ELISA was used to measure apoptotic cell death. Rate of apoptosis is reflected by the enrichment of nucleosomes released in each sample. The ratio of the absorbance of the treated cells to the untreated cells (CTRL) was calculated as an enrichment factor. Data represent the means ± S.E. e, MCF-10A cells were treated as described in the legend to a. After treatment with the indicated compounds for 48 h, cell extracts were prepared and analyzed for PARP cleavage. Of note, PARP cleavage was not detectable in TGZ-treated MCF-10A cells, most likely because most of the TGZ-treated MCF-10A cells already died by the 48 h of TGZ treatment.
FIGURE 2.
FIGURE 2.
Signaling pathways in HRG/TGZ-induced breast cancer cell death. a, MCF-7 cells were treated as described in the legend to Fig. 1. Cells were harvested at indicated times post-treatment, and cell lysates were then analyzed by Western blot for phosphorylated and total cellular proteins using specific antibodies as indicated. C, control, untreated cells; H, HRG; T, TGZ; HT, HRG and TGZ. Representative data from one of three independent experiments are shown. b, effect of p38 MAPK inhibitor (SB 203580) on HRG/TGZ-induced apoptotic cell death. MCF-7 cells were treated with combination of HRG and TGZ in the absence (HRG/TGZ (HT)) or presence of 4 μm SB 203580 (HT+SB). DNA fragmentation, which represents one of the hallmarks of apoptosis, was quantitated using the cell death detection ELISA kit (Roche Applied Science). The enrichment factor was used as a parameter of apoptosis. The rate of apoptosis is reflected by the enrichment of mono- and oligonucleosomes released into the cytoplasm shown on the y axis; an enrichment factor of 1 is equivalent to background apoptosis. The enrichment factor was calculated as the ratio between the absorbance measurements of treated cells and the basal value (untreated control cells). Data represent the mean ± S.E. from three experiments performed in duplicate. c, blockade of the late phase of p38 MAPK activation provides more protection from HRG/TGZ-induced apoptosis than the early phase blockade. To block the early phase p38 MAPK activation, MCF-7 cells were pretreated with p38 MAPK inhibitor (SB 203580, 4 μm) for 1 h, and then the media were replaced with fresh media containing HRG/TGZ and 4 μm SB 203580. After 5 h, the incubation medium was removed, and the cells were washed twice to get rid of SB 203580. Cells were then cultured in media containing HRG/TGZ until 48 h after initial HRG/TGZ treatment. Note that p38 MAPK activity is reversible if SB 203580 is removed. To block the late phase p38 MAPK activation, 4 μm SB 203580 was treated after the early phase p38 MAPK activation (5 h after HRG/TGZ treatment). Note that cell lysates were analyzed at 48 h after initial HRG/TGZ treatment, and thus p38 MAPK activity shown in this figure (P-p38 MAPK) represents the late phase p38 MAPK activity. Data shown are representative of three independent experiments. d, MCF-7 cells were transiently transfected with the reporter plasmid containing the PPAR-response element and internal control (pRL-SV40). The reporter-transfected cells were then incubated with each compound as indicated. The data were normalized to the Renilla luciferase and expressed as fold increase relative to that of control cells. Data represent the mean ± S.E. from three experiments performed in duplicate. C, control, untreated cells; H, HRG; T, TGZ; HT, HRG and TGZ.
FIGURE 3.
FIGURE 3.
HRG/TGZ induces both apoptotic and nonapoptotic/necrotic cell death but the primary mode is necrosis. a, effect of Z-VAD-fmk on HRG/TGZ-induced apoptotic cell death. MCF-7 cells were treated with HRG and TGZ in the absence (HT) or presence (HT+zVAD) of 20 μm Z-VAD-fmk. Cell death detection ELISA was used to measure apoptotic cell death. Rate of apoptosis is reflected by the enrichment of nucleosomes released in each sample. The enrichment factor was calculated as described in Fig. 2b legend. Data represent the mean ± S.E. from three independent experiments performed in duplicate. b, MCF-7 cells were pretreated with 10 mm methyl pyruvate (HT+MePyr) or 10 mm 3-Methyladenine (HT+3-MA) for 1 h and then treated for 48 h with HRG and TGZ. Cells were then stained with YO-PRO-1 and PI and analyzed by flow cytometry. Plots are representative from two independent experiments. c, electron microscopy of HRG/TGZ-treated MCF-7 cells. MCF-7 cells were either left untreated (C) or treated (HT) for 48 h with HRG/TGZ. Cells were fixed in glutaraldehyde and examined under an electron microscope. Bar represents 2 μm. The accompanying graph (right panel) shows the electron microscopic quantitation of apoptotic and necrotic cells. The percentages of cell numbers showing apoptosis- and necrosis-like morphological changes were calculated by counting ∼200 cells from randomly selected areas (>90 fields). Results are presented as mean ± S.E. (p < 0.01). d, effect of HRG/TGZ treatment on intracellular ATP level. MCF-7 cells were either left untreated (C) or treated for 48 h with 10 mm methyl pyruvate (HT+MePyr) or with 10 mm sodium pyruvate (HT+NaPyr) in the presence of HRG/TGZ (HT). ATP level was measured using a luminescence ATP detection system as described under “Experimental Procedures.” Luminescence was measured as counts/s (cps) and normalized to total protein concentration for each sample. The relative ATP level was calculated by dividing the normalized cps of the treated samples by that of the control samples. Bars correspond to means ± S.E. from at least five independent experiments carried out in duplicate. e, MCF-7 cells were treated for 48 h with the indicated compounds and the pH of media was measured. Data are representative of at least three independent experiments. C, control, untreated cells; H, HRG; T, TGZ; HT, HRG and TGZ.
FIGURE 4.
FIGURE 4.
HRG/TGZ treatment results in increased superoxide production and loss of mitochondrial membrane potential. a, MCF-7 cells were cultured for 24 h with each compound as indicated. Cells were then stained with JC-1 mitochondrial membrane potential detection kit for 10 min and analyzed by flow cytometry. Cells with intact mitochondrial membrane potential are found in the top right quadrant of the plots. Cells with impaired mitochondrial membrane potential are found in the low right quadrant of the plots. Note the shift to the lower right part of the quadrants in HRG/TGZ (HT)-treated cells. Numbers indicate the percentage of cells in the upper and lower quadrant. Representative data from one of three independent experiments are shown. b, to measure mitochondrial ROS, MCF-7 cells were treated for 16 h with the indicated compounds and stained with MitoSOX Red. Gates to determine percent MitoSOX-positive cells were set to exclude 95–98% of control cells (C, untreated). Numbers in the upper left of each dot blot indicate the percentage of cells staining positively with MitoSOX Red. A representative blot is shown. C, control, untreated cells; H, HRG; T, TGZ; HT, HRG and TGZ.
FIGURE 5.
FIGURE 5.
Antioxidants NAC and catalase protect cells from the cell death induced by HRG/TGZ. a, effect of NAC on HRG/TGZ-induced cell death. Phase contrast images of cells treated with HRG/TGZ (HT) and HRG/TGZ+NAC (HT+NAC) are shown. b, effect of NAC on HRG/TGZ-induced apoptosis. NAC (5 mm) was pretreated for 1 h before HRG/TGZ treatment. After 48 h of HRG/TGZ treatment, cell death detection ELISA was used to measure apoptotic cell death. The enrichment factor was calculated as described in Fig. 2 legend. Data represent the mean ± S.E. from three experiments performed in duplicate. c, cells were treated with HRG/TGZ in the presence (+) or absence (−) of NAC under similar cell culture conditions as described above. Cells were collected at 48 h after HRG/TGZ treatment and analyzed for p38 MAPK phosphorylation by Western blot. d, effect of catalase on HRG/TGZ-induced PARP cleavage. MCF-7 cells were transduced with adenoviral vectors encoding catalase (Ad-catalase) or empty vector (Ad-GFP) as a control. Transduction of cells by Ad-GFP or Ad-catalase was confirmed by GFP expression (at least 80% of transduction efficiency is based on GFP expression). Transduced cells were then treated with HRG/TGZ for 36 h, and the level of PARP cleavage was measured. e, MCF-7 cells grown on glass coverslips were treated as indicated. Cells were stained with antibodies to LC3 (green), cytokeratin (red), and DAPI (blue). The number of cells with a punctate LC3 pattern was quantified by counting more than 100 cells from at least three randomly selected fields, and the results represent the mean ± S.E. (p < 0.01). f, MCF-7 cells were cultured with each compound as indicated in the presence (+) or absence (−) of NAC. Cells were then analyzed for the levels of LC3II. C, control, untreated cells; H, HRG; T, TGZ; HT, HRG and TGZ. g, formation of autophagosomes was confirmed through electron microscopy. MCF-7 cells were treated for 48 h with HRG/TGZ. Cells were then fixed and examined as described in Fig. 3c. At a high magnification, HRG/TGZ-treated cells exhibited typical morphological features of autophagy. Bar represents 100 nm. h, left panel, MCF-7 cells transfected with either scrambled control siRNA (HT+scramble siRNA) or ATG7 siRNA (HT+ATG7 siRNA) were treated with HRG/TGZ for 48 h. Cell lysates were then analyzed by immunoblot analysis with the anti-ATG7 or LC3II antibody. Right panel, MCF-7 cells were transfected with siRNAs as indicated and treated with HRG/TGZ for 30–36 h. Cell death was analyzed by PI staining as described in the legend to Fig. 1. Numbers indicate the percentage of PI-positive cells. Please note that cells were retrieved for PI staining at an earlier time point (30–36 h after HRG/TGZ treatment) and thus showed lower level of cell death compared with corresponding cells treated for 48 h.
FIGURE 6.
FIGURE 6.
HRG/TGZ induces DNA damage through oxidative stress. a, immunocytochemical staining of γ-H2AX was performed as described under “Experimental Procedures.” MCF-7 cells were incubated with the indicated compounds for 40 h. They were then stained for the presence of phosphorylated γ-H2AX (left panels). The nuclei were visualized by DAPI staining (right panels). A representative image is shown. C, control, untreated cells; H, HRG; T, TGZl; HT, HRG and TGZ. b, MCF-7 cells were incubated for 40 h with the indicated compounds. Cell lysates were analyzed by Western blot for the expression of phosphorylated γ-H2AX. C, control, untreated cells; H, HRG; T, TGZ; HT, HRG and TGZ.

Similar articles

Cited by

References

    1. Le X. F., Varela C. R., Bast R. C., Jr. (2002) Apoptosis 7, 483–491 - PubMed
    1. Lupu R., Cardillo M., Cho C., Harris L., Hijazi M., Perez C., Rosenberg K., Yang D., Tang C. (1996) Breast Cancer Res. Treat. 38, 57–66 - PubMed
    1. Vadlamudi R., Adam L., Tseng B., Costa L., Kumar R. (1999) Cancer Res. 59, 2843–2846 - PubMed
    1. Xu F., Yu Y., Le X. F., Boyer C., Mills G. B., Bast R. C., Jr. (1999) Clin. Cancer Res. 5, 3653–3660 - PubMed
    1. Hutcheson I. R., Knowlden J. M., Hiscox S. E., Barrow D., Gee J. M., Robertson J. F., Ellis I. O., Nicholson R. I. (2007) Breast Cancer Res. 9, R50. - PMC - PubMed

Publication types

MeSH terms