

Genetic architecture of regulatory variation in Arabidopsis thaliana
- PMID: 21467266
- PMCID: PMC3083089
- DOI: 10.1101/gr.115337.110
Genetic architecture of regulatory variation in Arabidopsis thaliana
Abstract
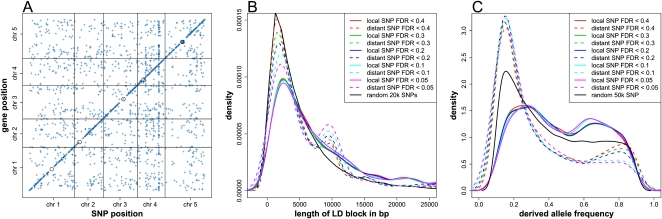
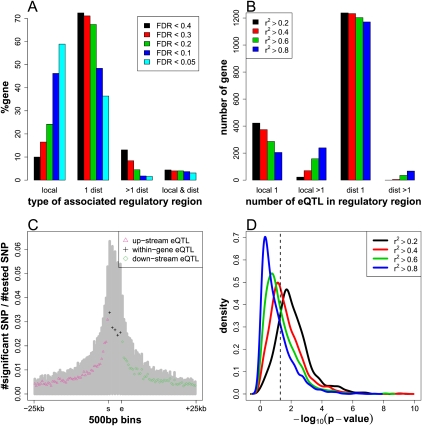
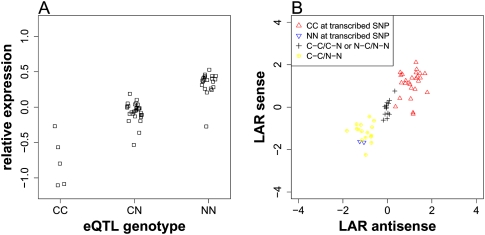
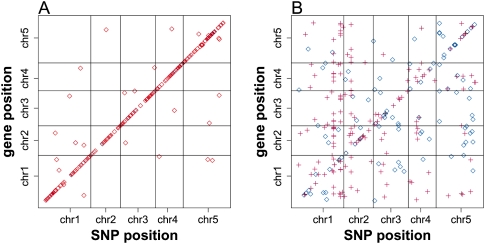
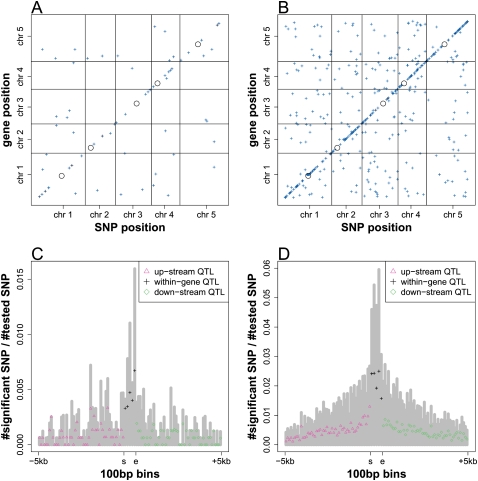
Studying the genetic regulation of expression variation is a key method to dissect complex phenotypic traits. To examine the genetic architecture of regulatory variation in Arabidopsis thaliana, we performed genome-wide association (GWA) mapping of gene expression in an F(1) hybrid diversity panel. At a genome-wide false discovery rate (FDR) of 0.2, an associated single nucleotide polymorphism (SNP) explains >38% of trait variation. In comparison with SNPs that are distant from the genes to which they were associated, locally associated SNPs are preferentially found in regions with extended linkage disequilibrium (LD) and have distinct population frequencies of the derived alleles (where Arabidopsis lyrata has the ancestral allele), suggesting that different selective forces are acting. Locally associated SNPs tend to have additive inheritance, whereas distantly associated SNPs are primarily dominant. In contrast to results from mapping of expression quantitative trait loci (eQTL) in linkage studies, we observe extensive allelic heterogeneity for local regulatory loci in our diversity panel. By association mapping of allele-specific expression (ASE), we detect a significant enrichment for cis-acting variation in local regulatory variation. In addition to gene expression variation, association mapping of splicing variation reveals both local and distant genetic regulation for intron and exon level traits. Finally, we identify candidate genes for 59 diverse phenotypic traits that were mapped to eQTL.
Figures
Similar articles
-
Novel Genes Affecting the Interaction between the Cabbage Whitefly and Arabidopsis Uncovered by Genome-Wide Association Mapping.PLoS One. 2015 Dec 23;10(12):e0145124. doi: 10.1371/journal.pone.0145124. eCollection 2015. PLoS One. 2015. PMID: 26699853 Free PMC article.
-
Understanding the evolution of defense metabolites in Arabidopsis thaliana using genome-wide association mapping.Genetics. 2010 Jul;185(3):991-1007. doi: 10.1534/genetics.109.108522. Epub 2009 Sep 7. Genetics. 2010. PMID: 19737743 Free PMC article.
-
The Multi-allelic Genetic Architecture of a Variance-Heterogeneity Locus for Molybdenum Concentration in Leaves Acts as a Source of Unexplained Additive Genetic Variance.PLoS Genet. 2015 Nov 23;11(11):e1005648. doi: 10.1371/journal.pgen.1005648. eCollection 2015 Nov. PLoS Genet. 2015. PMID: 26599497 Free PMC article.
-
Genome-wide association studies in plants: the missing heritability is in the field.Genome Biol. 2011 Oct 28;12(10):232. doi: 10.1186/gb-2011-12-10-232. Genome Biol. 2011. PMID: 22035733 Free PMC article. Review.
-
Global properties and functional complexity of human gene regulatory variation.PLoS Genet. 2013 May;9(5):e1003501. doi: 10.1371/journal.pgen.1003501. Epub 2013 May 30. PLoS Genet. 2013. PMID: 23737752 Free PMC article. Review.
Cited by
-
Genetic dissection of the Drosophila melanogaster female head transcriptome reveals widespread allelic heterogeneity.PLoS Genet. 2014 May 8;10(5):e1004322. doi: 10.1371/journal.pgen.1004322. eCollection 2014 May. PLoS Genet. 2014. PMID: 24810915 Free PMC article.
-
A New Mechanism for Mendelian Dominance in Regulatory Genetic Pathways: Competitive Binding by Transcription Factors.Genetics. 2017 Jan;205(1):101-112. doi: 10.1534/genetics.116.195255. Epub 2016 Nov 18. Genetics. 2017. PMID: 27866169 Free PMC article.
-
Diallel panel reveals a significant impact of low-frequency genetic variants on gene expression variation in yeast.Mol Syst Biol. 2024 Apr;20(4):362-373. doi: 10.1038/s44320-024-00021-0. Epub 2024 Feb 14. Mol Syst Biol. 2024. PMID: 38355920 Free PMC article.
-
Prioritization of candidate genes in QTL regions based on associations between traits and biological processes.BMC Plant Biol. 2014 Dec 10;14:330. doi: 10.1186/s12870-014-0330-3. BMC Plant Biol. 2014. PMID: 25492368 Free PMC article.
-
Genetic basis of transcriptome diversity in Drosophila melanogaster.Proc Natl Acad Sci U S A. 2015 Nov 3;112(44):E6010-9. doi: 10.1073/pnas.1519159112. Epub 2015 Oct 19. Proc Natl Acad Sci U S A. 2015. PMID: 26483487 Free PMC article.
References
-
- Alonso CR, Wilkins AS 2005. Opinion: the molecular elements that underlie developmental evolution. Nat Rev Genet 6: 709–715 - PubMed
-
- Babbitt CC, Silverman JS, Haygood R, Reininga JM, Rockman MV, Wray GA 2009. Multiple functional variants in cis modulate PDYN expression. Mol Biol Evol 27: 465–479 - PubMed
-
- Baxter I, Brazelton JN, Yu D, Huang YS, Lahner B, Yakubova E, Li Y, Bergelson J, Borevitz JO, Nordborg M, et al. 2010. A coastal cline in sodium accumulation in Arabidopsis thaliana is driven by natural variation of the sodium transporter AtHKT1;1. PLoS Genet 6: e1001193 doi: 10.1371/journal.pgen.1001193 - PMC - PubMed
Publication types
MeSH terms
Substances
Associated data
- Actions
Grants and funding
LinkOut - more resources
Full Text Sources
Other Literature Sources
Molecular Biology Databases
Research Materials