

Comprehensive long-span paired-end-tag mapping reveals characteristic patterns of structural variations in epithelial cancer genomes
- PMID: 21467267
- PMCID: PMC3083083
- DOI: 10.1101/gr.113555.110
Comprehensive long-span paired-end-tag mapping reveals characteristic patterns of structural variations in epithelial cancer genomes
Abstract
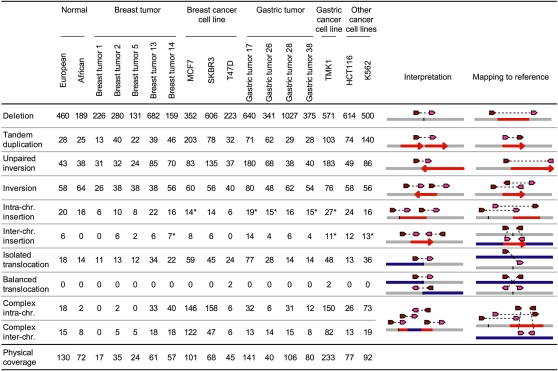
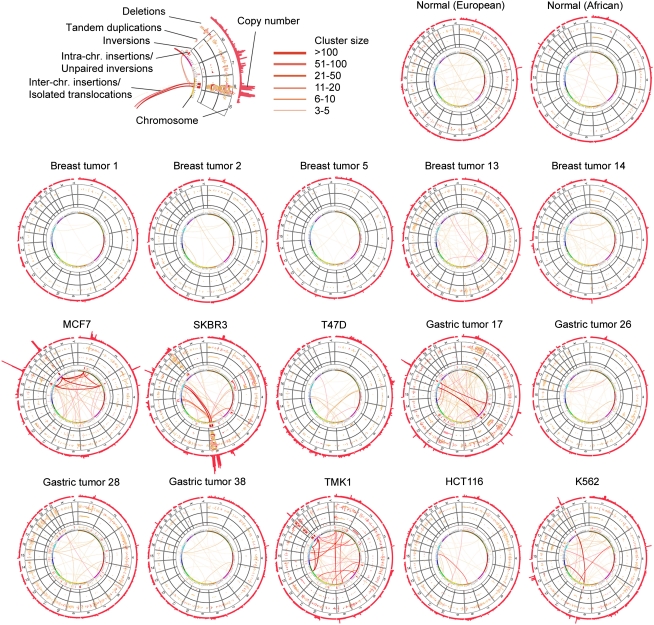
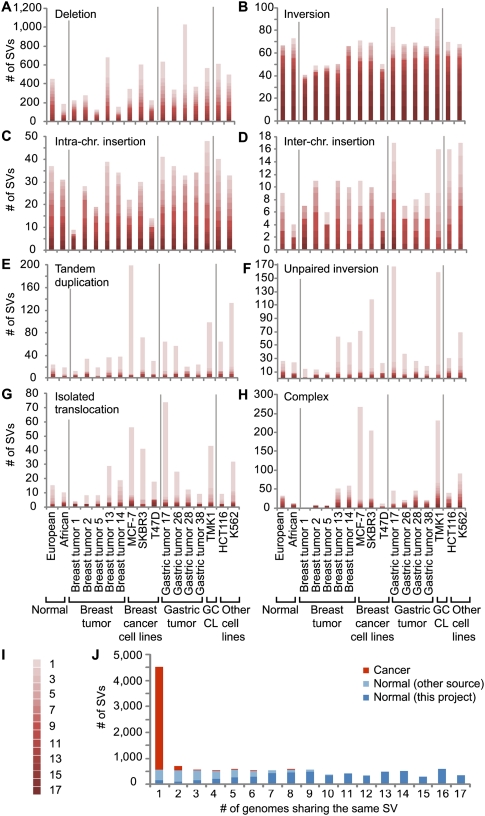
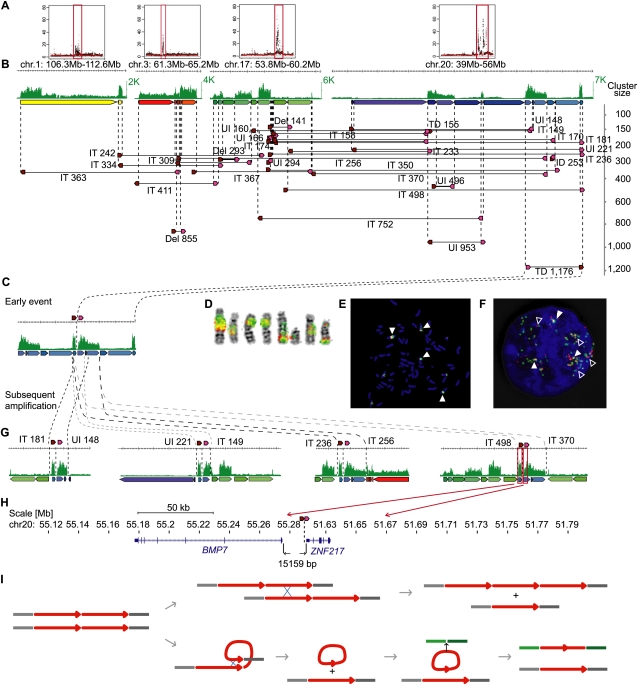
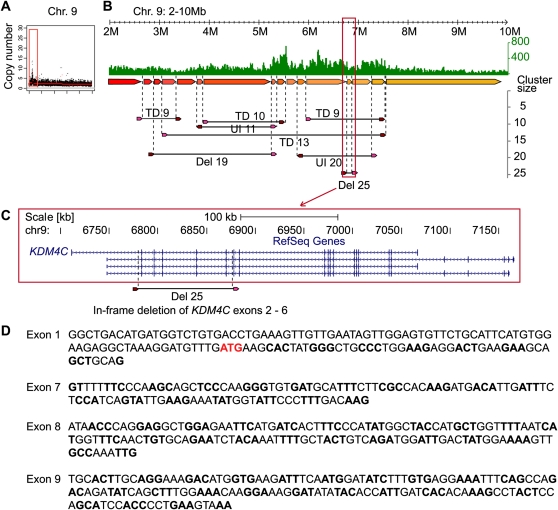
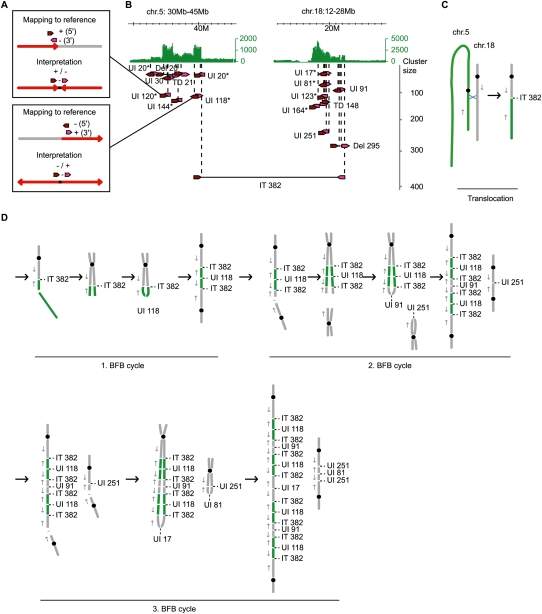
Somatic genome rearrangements are thought to play important roles in cancer development. We optimized a long-span paired-end-tag (PET) sequencing approach using 10-Kb genomic DNA inserts to study human genome structural variations (SVs). The use of a 10-Kb insert size allows the identification of breakpoints within repetitive or homology-containing regions of a few kilobases in size and results in a higher physical coverage compared with small insert libraries with the same sequencing effort. We have applied this approach to comprehensively characterize the SVs of 15 cancer and two noncancer genomes and used a filtering approach to strongly enrich for somatic SVs in the cancer genomes. Our analyses revealed that most inversions, deletions, and insertions are germ-line SVs, whereas tandem duplications, unpaired inversions, interchromosomal translocations, and complex rearrangements are over-represented among somatic rearrangements in cancer genomes. We demonstrate that the quantitative and connective nature of DNA-PET data is precise in delineating the genealogy of complex rearrangement events, we observe signatures that are compatible with breakage-fusion-bridge cycles, and we discover that large duplications are among the initial rearrangements that trigger genome instability for extensive amplification in epithelial cancers.
Figures
Similar articles
-
Long span DNA paired-end-tag (DNA-PET) sequencing strategy for the interrogation of genomic structural mutations and fusion-point-guided reconstruction of amplicons.PLoS One. 2012;7(9):e46152. doi: 10.1371/journal.pone.0046152. Epub 2012 Sep 28. PLoS One. 2012. PMID: 23029419 Free PMC article.
-
Ulysses: accurate detection of low-frequency structural variations in large insert-size sequencing libraries.Bioinformatics. 2015 Mar 15;31(6):801-8. doi: 10.1093/bioinformatics/btu730. Epub 2014 Nov 7. Bioinformatics. 2015. PMID: 25380961
-
Whole-genome sequencing with long reads reveals complex structure and origin of structural variation in human genetic variations and somatic mutations in cancer.Genome Med. 2021 Apr 29;13(1):65. doi: 10.1186/s13073-021-00883-1. Genome Med. 2021. PMID: 33910608 Free PMC article.
-
Geographic distribution and adaptive significance of genomic structural variants: an anthropological genetics perspective.Hum Biol. 2014 Fall;86(4):260-75. doi: 10.13110/humanbiology.86.4.0260. Hum Biol. 2014. PMID: 25959693 Review.
-
Insights into structural variations and genome rearrangements in prokaryotic genomes.Bioinformatics. 2015 Jan 1;31(1):1-9. doi: 10.1093/bioinformatics/btu600. Epub 2014 Sep 4. Bioinformatics. 2015. PMID: 25189783 Review.
Cited by
-
Generation of long insert pairs using a Cre-LoxP Inverse PCR approach.PLoS One. 2012;7(1):e29437. doi: 10.1371/journal.pone.0029437. Epub 2012 Jan 9. PLoS One. 2012. PMID: 22253722 Free PMC article.
-
Comprehensive characterization of the genomic alterations in human gastric cancer.Int J Cancer. 2015 Jul 1;137(1):86-95. doi: 10.1002/ijc.29352. Epub 2014 Dec 3. Int J Cancer. 2015. PMID: 25422082 Free PMC article.
-
Long span DNA paired-end-tag (DNA-PET) sequencing strategy for the interrogation of genomic structural mutations and fusion-point-guided reconstruction of amplicons.PLoS One. 2012;7(9):e46152. doi: 10.1371/journal.pone.0046152. Epub 2012 Sep 28. PLoS One. 2012. PMID: 23029419 Free PMC article.
-
Transcriptional consequences of genomic structural aberrations in breast cancer.Genome Res. 2011 May;21(5):676-87. doi: 10.1101/gr.113225.110. Epub 2011 Apr 5. Genome Res. 2011. PMID: 21467264 Free PMC article.
-
A Pan-Cancer Compendium of Genes Deregulated by Somatic Genomic Rearrangement across More Than 1,400 Cases.Cell Rep. 2018 Jul 10;24(2):515-527. doi: 10.1016/j.celrep.2018.06.025. Cell Rep. 2018. PMID: 29996110 Free PMC article.
References
-
- Daley GQ, Van Etten RA, Baltimore D 1990. Induction of chronic myelogenous leukemia in mice by the P210bcr/abl gene of the Philadelphia chromosome. Science 247: 824–830 - PubMed
Publication types
MeSH terms
Substances
Associated data
- Actions
Grants and funding
LinkOut - more resources
Full Text Sources
Other Literature Sources
Medical
Molecular Biology Databases