

Role of diabetes- and obesity-related protein in the regulation of osteoblast differentiation
- PMID: 21467300
- PMCID: PMC3129842
- DOI: 10.1152/ajpendo.00065.2011
Role of diabetes- and obesity-related protein in the regulation of osteoblast differentiation
Abstract
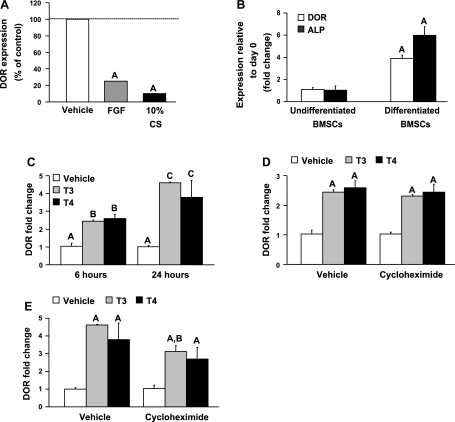
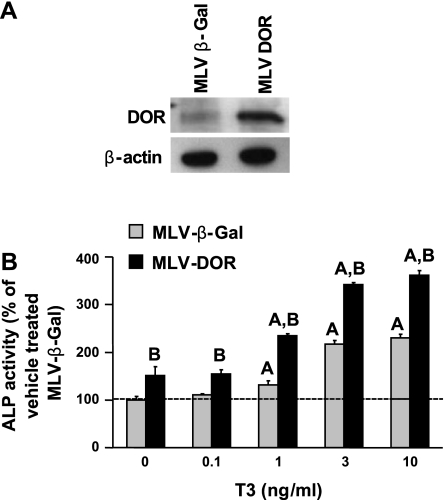
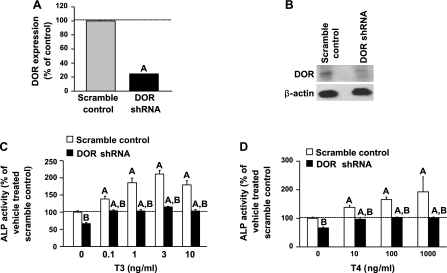
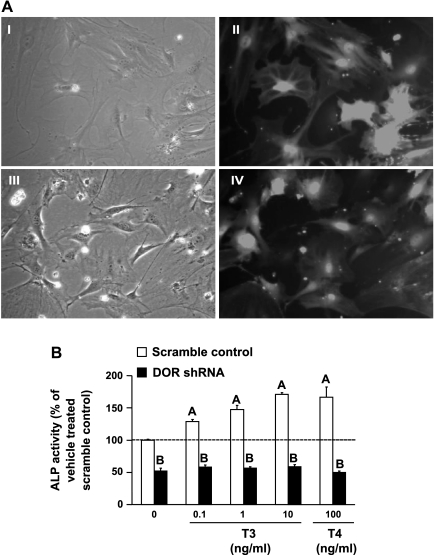
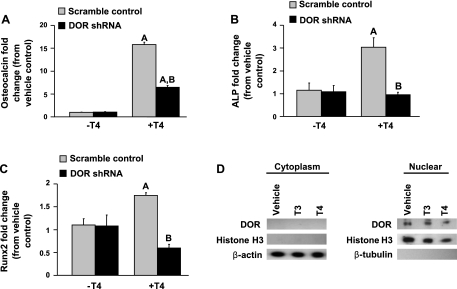
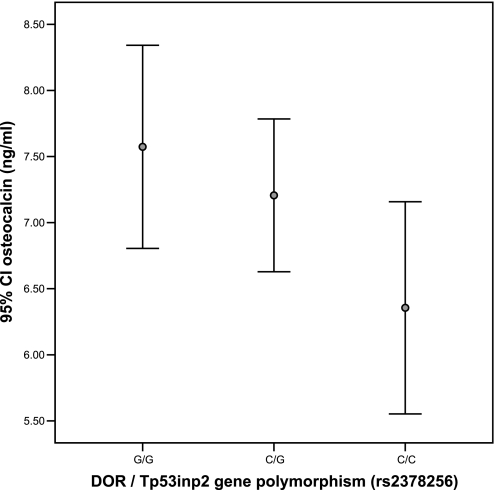
Although thyroid hormone (TH) is known to exert important effects on the skeleton, the nuclear factors constituting the TH receptor coactivator complex and the molecular pathways by which TH mediates its effects on target gene expression in osteoblasts remain poorly understood. A recent study demonstrated that the actions of TH on myoblast differentiation are dependent on diabetes- and obesity-related protein (DOR). However, the role of DOR in osteoblast differentiation is unknown. We found DOR expression increased during in vitro differentiation of bone marrow stromal cells into osteoblasts and also in MC3T3-E1 cells treated with TH. However, DOR expression decreased during cellular proliferation. To determine whether DOR acts as a modulator of TH action during osteoblast differentiation, we examined whether overexpression or knockdown of DOR in MC3T3-E1 cells affects the ability of TH to induce osteoblast differentiation by evaluating alkaline phosphatase (ALP) activity. ALP activity was markedly increased in DOR-overexpressing cells treated with TH. In contrast, loss of DOR dramatically reduced TH stimulation of ALP activity in MC3T3-E1 cells and primary calvaria osteoblasts transduced with lentiviral DOR shRNA. Consistent with reduced ALP activity, mRNA levels of osteocalcin, ALP, and Runx2 were decreased significantly in DOR shRNA cells. In addition, a common single nucleotide polymorphism (SNP), DOR1 found on the promoter of human DOR gene, was associated with circulating osteocalcin levels in nondiabetic subjects. Based on these data, we conclude that DOR plays an important role in TH-mediated osteoblast differentiation, and a DOR SNP associates with plasma osteocalcin in men.
Figures
Similar articles
-
Fidgetin-like 1 gene inhibited by basic fibroblast growth factor regulates the proliferation and differentiation of osteoblasts.J Bone Miner Res. 2007 Jun;22(6):889-96. doi: 10.1359/jbmr.070311. J Bone Miner Res. 2007. PMID: 17352653
-
Akt activation is required for TGF-β1-induced osteoblast differentiation of MC3T3-E1 pre-osteoblasts.PLoS One. 2014 Dec 3;9(12):e112566. doi: 10.1371/journal.pone.0112566. eCollection 2014. PLoS One. 2014. PMID: 25470129 Free PMC article.
-
BST2 Mediates Osteoblast Differentiation via the BMP2 Signaling Pathway in Human Alveolar-Derived Bone Marrow Stromal Cells.PLoS One. 2016 Jun 30;11(6):e0158481. doi: 10.1371/journal.pone.0158481. eCollection 2016. PLoS One. 2016. PMID: 27359105 Free PMC article.
-
Harmine promotes osteoblast differentiation through bone morphogenetic protein signaling.Biochem Biophys Res Commun. 2011 Jun 3;409(2):260-5. doi: 10.1016/j.bbrc.2011.05.001. Epub 2011 May 6. Biochem Biophys Res Commun. 2011. PMID: 21570953
-
Cyclic AMP Response Element-binding Protein H (CREBH) Mediates the Inhibitory Actions of Tumor Necrosis Factor α in Osteoblast Differentiation by Stimulating Smad1 Degradation.J Biol Chem. 2015 May 22;290(21):13556-66. doi: 10.1074/jbc.M114.587923. Epub 2015 Apr 14. J Biol Chem. 2015. PMID: 25873397 Free PMC article.
Cited by
-
Tumor protein p53-induced nuclear protein 2 modulates osteogenic differentiation of human adipose derived stem/stromal cells by activating Wnt/β-catenin signaling.Am J Transl Res. 2020 Oct 15;12(10):6853-6867. eCollection 2020. Am J Transl Res. 2020. PMID: 33194077 Free PMC article.
-
Claudin 18 is a novel negative regulator of bone resorption and osteoclast differentiation.J Bone Miner Res. 2012 Jul;27(7):1553-65. doi: 10.1002/jbmr.1600. J Bone Miner Res. 2012. PMID: 22437732 Free PMC article.
-
Role and Mechanisms of Actions of Thyroid Hormone on the Skeletal Development.Bone Res. 2013 Jun 28;1(2):146-61. doi: 10.4248/BR201302004. eCollection 2013 Jun. Bone Res. 2013. PMID: 26273499 Free PMC article. Review.
-
Extrinsic and intrinsic regulation of DOR/TP53INP2 expression in mice: effects of dietary fat content, tissue type and sex in adipose and muscle tissues.Nutr Metab (Lond). 2012 Sep 21;9(1):86. doi: 10.1186/1743-7075-9-86. Nutr Metab (Lond). 2012. PMID: 22995226 Free PMC article.
-
Regulation of death receptor signaling by the autophagy protein TP53INP2.EMBO J. 2019 May 15;38(10):e99300. doi: 10.15252/embj.201899300. Epub 2019 Apr 12. EMBO J. 2019. PMID: 30979779 Free PMC article.
References
-
- Asai S, Cao X, Yamauchi M, Funahashi K, Ishiguro N, Kambe F. Thyroid hormone non-genomically suppresses Src thereby stimulating osteocalcin expression in primary mouse calvarial osteoblasts. Biochem Biophys Res Commun 387: 92–96, 2009 - PubMed
-
- Bassett J, Harvey C, Williams G. Mechanisms of thyroid hormone receptor-specific nuclear and extra nuclear actions. Mol Cell Endocrinol 213: 1–11, 2003 - PubMed
-
- Bassett J, Williams G. Critical role of the hypothalamic-pituitary-thyroid axis in bone. Bone 43: 418–426, 2008 - PubMed
-
- Bassett J, Williams G. The molecular actions of thyroid hormone in bone. Trends Endocrinol Metab 14: 356–364, 2003 - PubMed
Publication types
MeSH terms
Substances
Grants and funding
LinkOut - more resources
Full Text Sources
Molecular Biology Databases