. 2011 Jun;188(2):449-60.
doi: 10.1534/genetics.111.128595. Epub 2011 Apr 5.

Increasing power of genome-wide association studies by collecting additional single-nucleotide polymorphisms

Affiliations

Increasing power of genome-wide association studies by collecting additional single-nucleotide polymorphisms

Emrah Kostem et al. Genetics. 2011 Jun.

Abstract

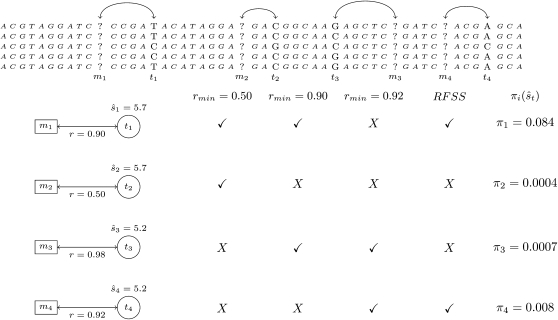
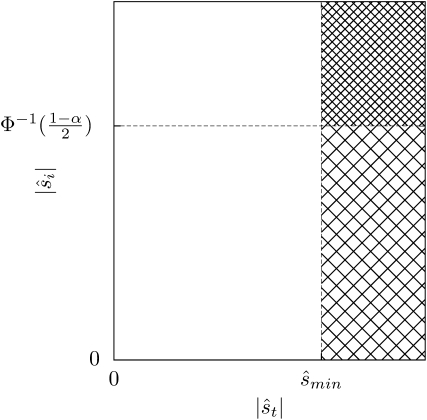
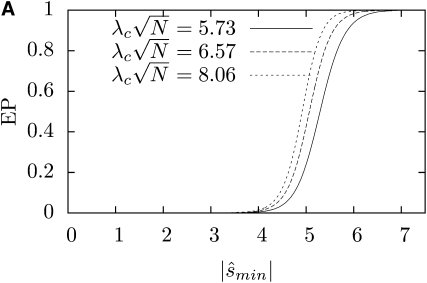
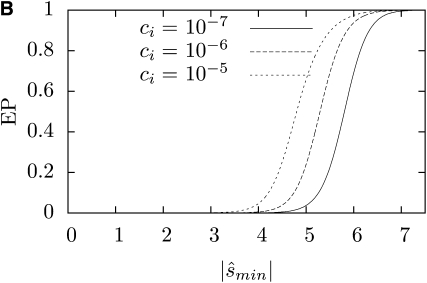
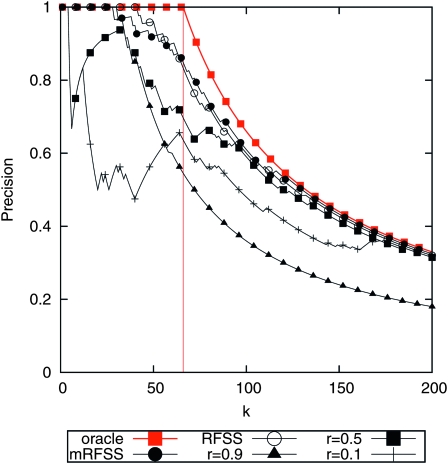
Genome-wide association studies (GWASs) have been effectively identifying the genomic regions associated with a disease trait. In a typical GWAS, an informative subset of the single-nucleotide polymorphisms (SNPs), called tag SNPs, is genotyped in case/control individuals. Once the tag SNP statistics are computed, the genomic regions that are in linkage disequilibrium (LD) with the most significantly associated tag SNPs are believed to contain the causal polymorphisms. However, such LD regions are often large and contain many additional polymorphisms. Following up all the SNPs included in these regions is costly and infeasible for biological validation. In this article we address how to characterize these regions cost effectively with the goal of providing investigators a clear direction for biological validation. We introduce a follow-up study approach for identifying all untyped associated SNPs by selecting additional SNPs, called follow-up SNPs, from the associated regions and genotyping them in the original case/control individuals. We introduce a novel SNP selection method with the goal of maximizing the number of associated SNPs among the chosen follow-up SNPs. We show how the observed statistics of the original tag SNPs and human genetic variation reference data such as the HapMap Project can be utilized to identify the follow-up SNPs. We use simulated and real association studies based on the HapMap data and the Wellcome Trust Case Control Consortium to demonstrate that our method shows superior performance to the correlation- and distance-based traditional follow-up SNP selection approaches. Our method is publicly available at http://genetics.cs.ucla.edu/followupSNPs.


Figures

F<sc>igure</sc> 1.—
Figure 1.—
Consider a genome-wide follow-up SNP selection with 106 candidate SNPs, where only 4 candidate SNPs m1, m2, m3, m4 and their tag SNPs t1, t2, t3, t4 are shown. Assuming λcN=5.73, ci = 10−6, and α = 10−8, the correct ranking of the 4 candidate SNPs is m1, m4, m3, and m2. Consider selecting 2 follow-up SNPs among the 4 candidate SNPs. The correlation-based traditional approach can realize this selection using three different minimum correlation cutoff values (rmin). Under the columns rmin = 0.50, rmin = 0.90, and rmin = 0.92, the follow-up SNPs selected under each cutoff value are indicated with a checkmark. Under the column πi(sˆt) the probability of each candidate SNP being statistically significant conditioned on its observed tag SNP is given. Unlike the proposed method, the correlation-based traditional approach fails to identify the optimal selection (m1 and m4) under all possible thresholds.
F<sc>igure</sc> 2.—
Figure 2.—
Cross-hatched regions represent where a candidate SNP is selected as a follow-up SNP on the basis of the observed statistic of its tag SNP. In the densely cross-hatched region at the top the follow-up SNP is statistically associated, whereas in the cross-hatched region at the bottom it is not.
F<sc>igure</sc> 3.—
Figure 3.—
The effect of (A) the noncentrality parameter, (B) probability of the candidate SNP being causal, and (C) the pairwise correlation in the expected performance (EP) is shown. The NCPs of 5.73, 6.57, and 8.06 correspond to 50%, 80%, and 99% statistical power at the causal SNP. The unknown parameters, noncentrality parameter of the causal SNP, λcN, and probability of a candidate SNP being causal, ci, have smaller impact in the performance compared to the pairwise correlation. (α = 10−8).
F<sc>igure</sc> 4.—
Figure 4.—
Sample performance evaluation under the ENCODE region ENm010.7p15.2 in the CEU population. (A) The correlation- and distance-based traditional approaches are compared to the optimal approach. (B) The effect of using wrong parameters in the performance of the proposed methods is shown.
F<sc>igure</sc> 5.—
Figure 5.—
Performance comparison of the traditional and proposed methods when incorrect correlation coefficients between the SNPs are used. Simulation is generated in the ENCODE region ENm010.7p15.2 in the CEU population and the correlation coefficients from the YRI population are used.
F<sc>igure</sc> 6
Figure 6
.—Green circles indicate the chosen candidate SNPs under each method in the ENCODE region ENm010.7p15.2 in the CEU population simulation data set. Red horizontal lines indicate the significance threshold and black circles indicate the causal SNPs. The traditional approach is shown via two minimum correlation cutoff values, (A) rmin = 0.1 and (B) rmin = 0.9, where rmin = 0.1 approximates the distance-based approach. Both of the proposed methods (C) and (D) identify a significantly higher number of causal SNPs, where the mRFSS method prioritizes causal candidate SNPs much more effectively.
F<sc>igure</sc> 7.—
Figure 7.—
Performance evaluation under rheumatoid arthritis (RA).
F<sc>igure</sc> 8.—
Figure 8.—
Concordance of the selected follow-up SNPs in rheumatoid arthritis (RA) between different framework parameters. θ1 ≡ (λcN=5.73, ci = 10−5). θ2 ≡ (λcN=6.57, ci = 10−8). θ3 ≡ (λcN=5.73, ci = 10−8). θ4 ≡ (λcN=6.57, ci = 10−5).

Similar articles

Cited by

References

    1. Altshuler D., Brooks L. D., Chakravarti A., Collins F. S., Daly M. J., et al. , 2005. A haplotype map of the human genome. Nature 437: 1299–1320 - PMC - PubMed
    1. Carlson C. S., Eberle M. A., Rieder M. J., Yi Q., Kruglyak L., et al. , 2004. Selecting a maximally informative set of single-nucleotide polymorphisms for association analyses using linkage disequilibrium. Am. J. Hum. Genet. 74: 106–120 - PMC - PubMed
    1. Cousin E., Genin E., Mace S., Ricard S., Chansac C., et al. , 2003. Association studies in candidate genes: strategies to select SNPs to be tested. Hum. Hered. 56: 151–159 - PubMed
    1. Cousin E., Deleuze J. F., Genin E., 2006. Selection of SNP subsets for association studies in candidate genes: comparison of the power of different strategies to detect single disease susceptibility locus effects. BMC Genet. 7: 20. - PMC - PubMed
    1. de Bakker P. I. W., Yelensky R., Pe’er I., Gabriel S. B., Daly M. J., et al. , 2005. Efficiency and power in genetic association studies. Nat. Genet. 37: 1217–1223 - PubMed

Publication types

MeSH terms