

A sister group contrast using untargeted global metabolomic analysis delineates the biochemical regulation underlying desiccation tolerance in Sporobolus stapfianus
- PMID: 21467579
- PMCID: PMC3101564
- DOI: 10.1105/tpc.110.082800
A sister group contrast using untargeted global metabolomic analysis delineates the biochemical regulation underlying desiccation tolerance in Sporobolus stapfianus
Abstract
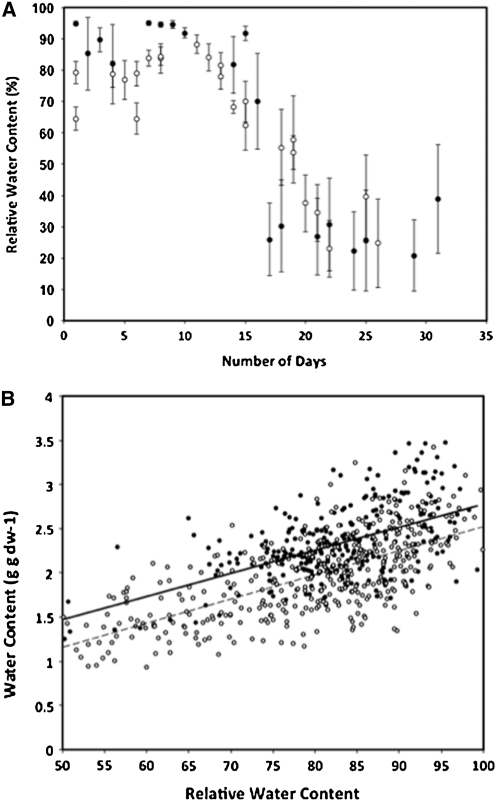
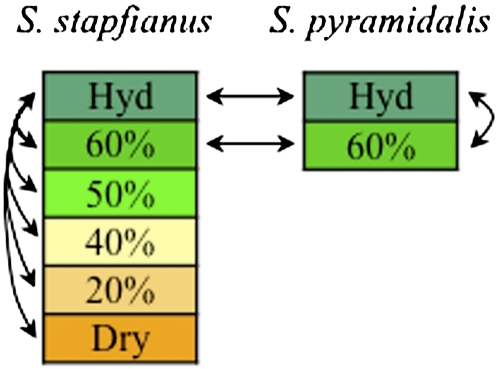
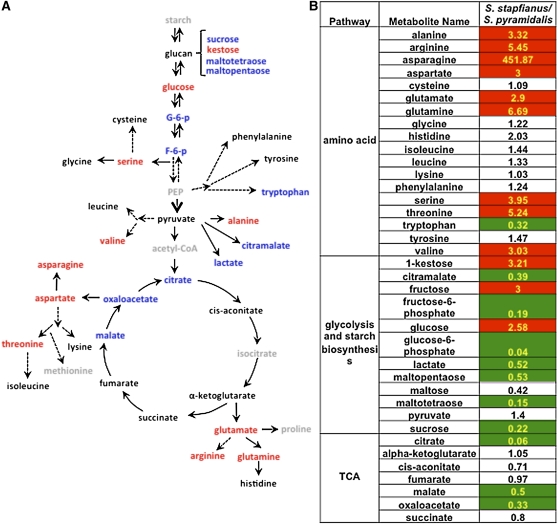
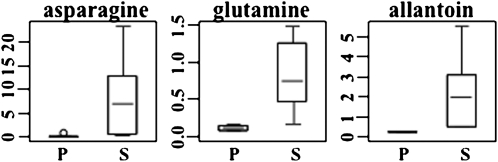
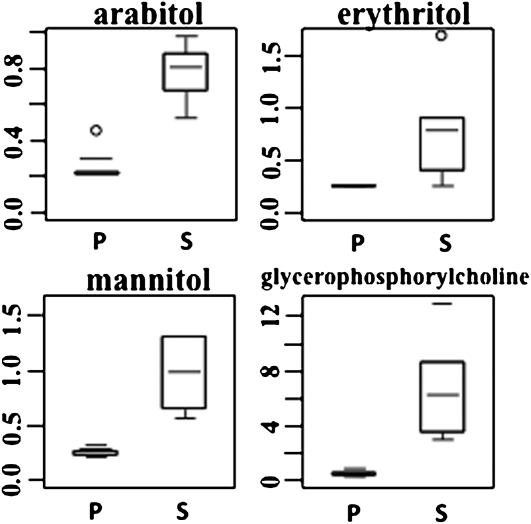
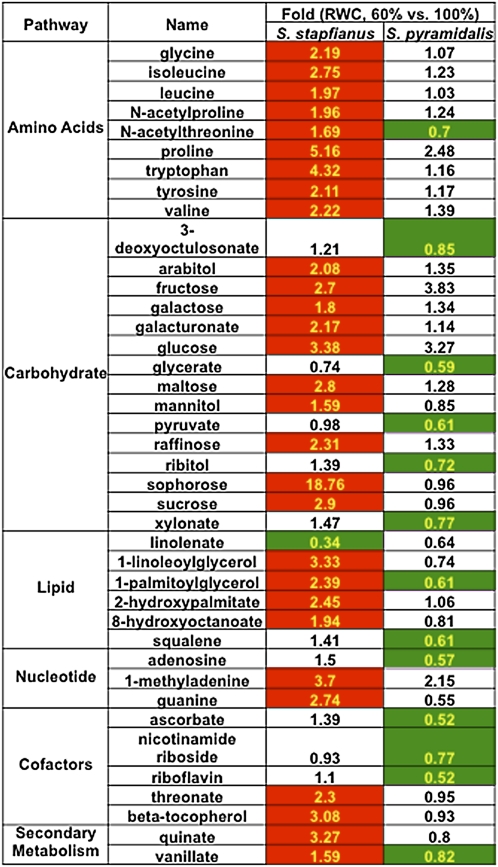
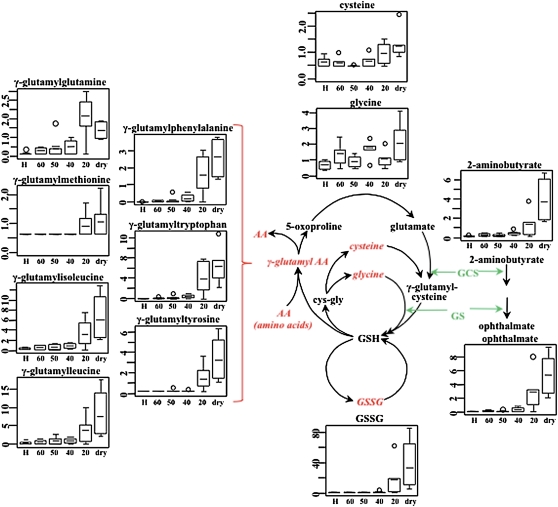
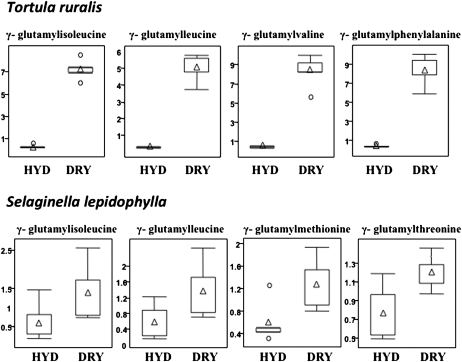
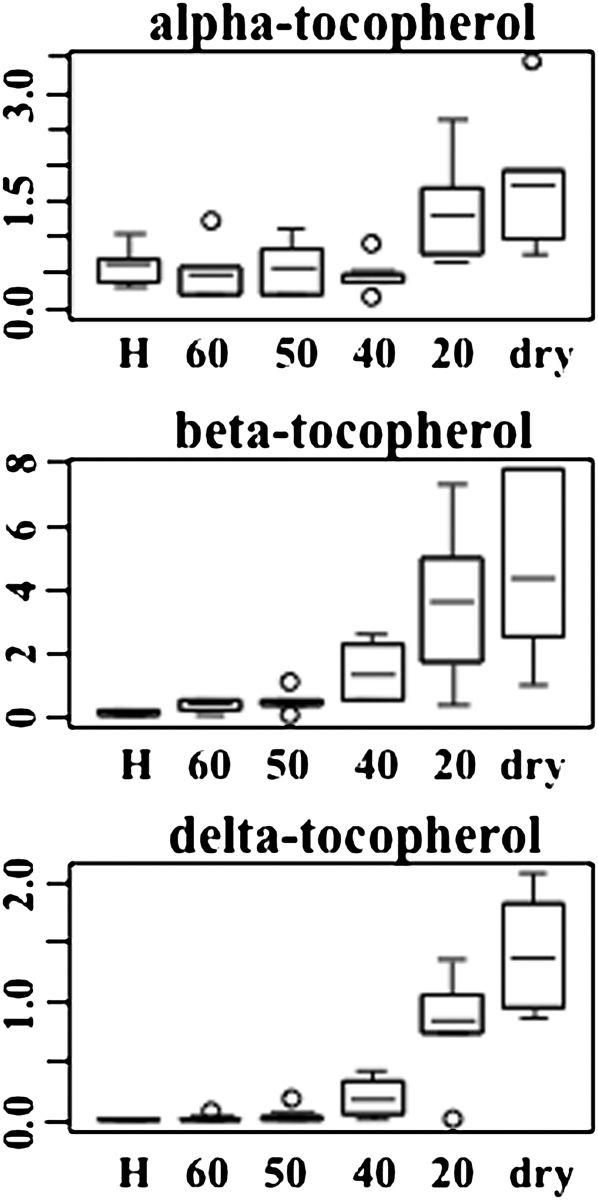
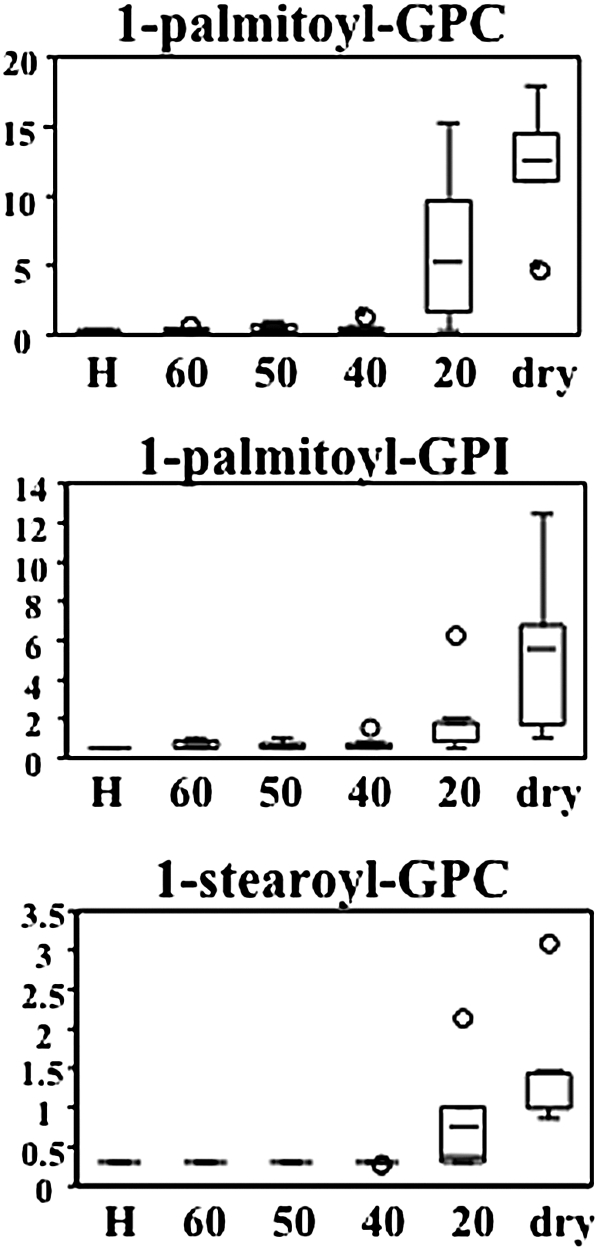
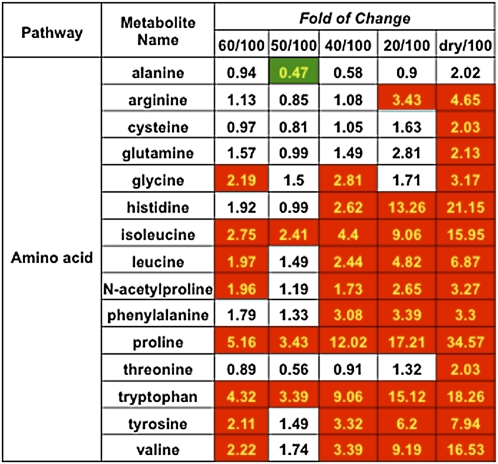
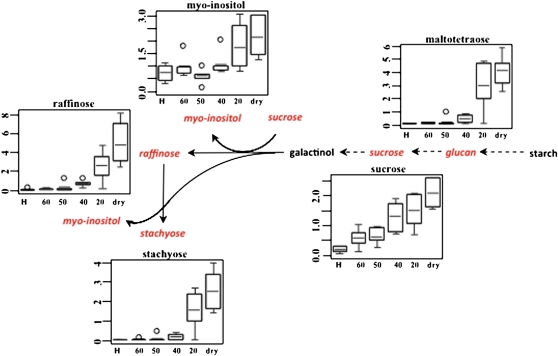
Understanding how plants tolerate dehydration is a prerequisite for developing novel strategies for improving drought tolerance. The desiccation-tolerant (DT) Sporobolus stapfianus and the desiccation-sensitive (DS) Sporobolus pyramidalis formed a sister group contrast to reveal adaptive metabolic responses to dehydration using untargeted global metabolomic analysis. Young leaves from both grasses at full hydration or at 60% relative water content (RWC) and from S. stapfianus at lower RWCs were analyzed using liquid and gas chromatography linked to mass spectrometry or tandem mass spectrometry. Comparison of the two species in the fully hydrated state revealed intrinsic differences between the two metabolomes. S. stapfianus had higher concentrations of osmolytes, lower concentrations of metabolites associated with energy metabolism, and higher concentrations of nitrogen metabolites, suggesting that it is primed metabolically for dehydration stress. Further reduction of the leaf RWC to 60% instigated a metabolic shift in S. stapfianus toward the production of protective compounds, whereas S. pyramidalis responded differently. The metabolomes of S. stapfianus leaves below 40% RWC were strongly directed toward antioxidant production, nitrogen remobilization, ammonia detoxification, and soluble sugar production. Collectively, the metabolic profiles obtained uncovered a cascade of biochemical regulation strategies critical to the survival of S. stapfianus under desiccation.
Figures


Similar articles
-
A comparative genomics examination of desiccation tolerance and sensitivity in two sister grass species.Proc Natl Acad Sci U S A. 2022 Feb 1;119(5):e2118886119. doi: 10.1073/pnas.2118886119. Proc Natl Acad Sci U S A. 2022. PMID: 35082155 Free PMC article.
-
Sporobolus stapfianus: Insights into desiccation tolerance in the resurrection grasses from linking transcriptomics to metabolomics.BMC Plant Biol. 2017 Mar 28;17(1):67. doi: 10.1186/s12870-017-1013-7. BMC Plant Biol. 2017. PMID: 28351347 Free PMC article.
-
Proteome analysis of leaves of the desiccation-tolerant grass, Sporobolus stapfianus, in response to dehydration.Phytochemistry. 2011 Jul;72(10):1273-84. doi: 10.1016/j.phytochem.2010.10.020. Epub 2010 Nov 23. Phytochemistry. 2011. PMID: 21109273
-
Drying without senescence in resurrection plants.Front Plant Sci. 2014 Feb 12;5:36. doi: 10.3389/fpls.2014.00036. eCollection 2014. Front Plant Sci. 2014. PMID: 24575108 Free PMC article. Review.
-
Molecular responses to dehydration and desiccation in desiccation-tolerant angiosperm plants.J Exp Bot. 2018 Jun 6;69(13):3211-3222. doi: 10.1093/jxb/erx489. J Exp Bot. 2018. PMID: 29385548 Review.
Cited by
-
Maintenance or collapse: responses of extraplastidic membrane lipid composition to desiccation in the resurrection plant Paraisometrum mileense.PLoS One. 2014 Jul 28;9(7):e103430. doi: 10.1371/journal.pone.0103430. eCollection 2014. PLoS One. 2014. PMID: 25068901 Free PMC article.
-
A toolbox of genes, proteins, metabolites and promoters for improving drought tolerance in soybean includes the metabolite coumestrol and stomatal development genes.BMC Genomics. 2016 Feb 9;17:102. doi: 10.1186/s12864-016-2420-0. BMC Genomics. 2016. PMID: 26861168 Free PMC article.
-
Development of interspecies hybrids to increase ginseng biomass and ginsenoside yield.Plant Cell Rep. 2016 Apr;35(4):779-90. doi: 10.1007/s00299-015-1920-8. Epub 2016 Jan 22. Plant Cell Rep. 2016. PMID: 26800977
-
Metabolomics, a Powerful Tool for Agricultural Research.Int J Mol Sci. 2016 Nov 17;17(11):1871. doi: 10.3390/ijms17111871. Int J Mol Sci. 2016. PMID: 27869667 Free PMC article. Review.
-
Metabolomic Profiling of Soybeans (Glycine max L.) Reveals the Importance of Sugar and Nitrogen Metabolism under Drought and Heat Stress.Plants (Basel). 2017 May 25;6(2):21. doi: 10.3390/plants6020021. Plants (Basel). 2017. PMID: 28587097 Free PMC article.
References
-
- Akashi K., Miyake C., Yokota A. (2001). Citrulline, a novel compatible solute in drought-tolerant wild watermelon leaves, is an efficient hydroxyl radical scavenger. FEBS Lett. 508: 438–442 - PubMed
-
- Alamillo J.M., Bartels D. (2001). Effects of desiccation on photosynthesis pigments and the ELIP-like dsp 22 protein complexes in the resurrection plant Craterostigma plantagineum. Plant Sci. 160: 1161–1170 - PubMed
-
- Alpert P., Oliver M.J. (2002). Drying without dying. In Desiccation and Survival in Plants: Drying without Dying. Black M., Pritchard H., eds (Oxford: CABI Publishing; ), pp. 3–43
-
- Atkinson J., Epand R.F., Epand R.M. (2008). Tocopherols and tocotrienols in membranes: A critical review. Free Radic. Biol. Med. 44: 739–764 - PubMed
-
- Berjak P. (2006). Unifying perspectives of some mechanisms basic to desiccation tolerance across life forms. Seed Sci. Res. 16: 1–15
Publication types
MeSH terms
Substances
LinkOut - more resources
Full Text Sources
Other Literature Sources
