. 2011 Apr;23(4):1536-55.
doi: 10.1105/tpc.110.080804. Epub 2011 Apr 5.

MATE2 mediates vacuolar sequestration of flavonoid glycosides and glycoside malonates in Medicago truncatula

Affiliations

MATE2 mediates vacuolar sequestration of flavonoid glycosides and glycoside malonates in Medicago truncatula

Jian Zhao et al. Plant Cell. 2011 Apr.

Abstract

The majority of flavonoids, such as anthocyanins, proanthocyanidins, and isoflavones, are stored in the central vacuole, but the molecular basis of flavonoid transport is still poorly understood. Here, we report the functional characterization of a multidrug and toxin extrusion transporter (MATE2), from Medicago truncatula. MATE 2 is expressed primarily in leaves and flowers. Despite its high similarity to the epicatechin 3'-O-glucoside transporter MATE1, MATE2 cannot efficiently transport proanthocyanidin precursors. In contrast, MATE2 shows higher transport capacity for anthocyanins and lower efficiency for other flavonoid glycosides. Three malonyltransferases that are coexpressed with MATE2 were identified. The malonylated flavonoid glucosides generated by these malonyltransferases are more efficiently taken up into MATE2-containing membrane vesicles than are the parent glycosides. Malonylation increases both the affinity and transport efficiency of flavonoid glucosides for uptake by MATE2. Genetic loss of MATE2 function leads to the disappearance of leaf anthocyanin pigmentation and pale flower color as a result of drastic decreases in the levels of various flavonoids. However, some flavonoid glycoside malonates accumulate to higher levels in MATE2 knockouts than in wild-type controls. Deletion of MATE2 increases seed proanthocyanidin biosynthesis, presumably via redirection of metabolic flux from anthocyanin storage.


Figures
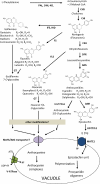
Figure 1.
Figure 1.
Pathways for Flavonoid Synthesis, Modification, and Transport. Enzymes are as follows: PAL, l-Phe ammonia-lyase; C4H, cinnamate 4-hydroxylase; 4CL, 4-coumarate:CoA ligase; CHS, chalcone synthase; CHI, chalcone isomerase; F3H, flavanone 3-hydroxylase; DFR, dihydroflavonol reductase; FS, flavone synthase; IFS, isoflavone synthase; HID, 2-hydroxyisoflavanone dehydratase; FLS, flavonol synthase; ANS, anthocyanidin synthase; ANR, anthocyanidin reductase; GT, glycosyltransferase; MaT, malonyl CoA:flavonoid acyltransferase; MATE, multidrug and toxin extrusion transporter; V-ATPase, vacuolar ATPase. [See online article for color version of this figure.]
Figure 2.
Figure 2.
Phylogeny and Transport Activity of MATE2. (A) Phylogenetic tree of MATE transporters. Protein sequences of the characterized MATE transporters from Arabidopsis, TT12, FFT, FRD3, ALF5, EDS5, and DXT1; M. truncatula MATE1 and MATE2; sorghum Sb MATE1; grapevine AM1 and AM3; tomato MTP77; barley Hv AACT1; tobacco JAT1, Nt MATE1, and Nt MATE2; as well as predicted MATE transporters CAO69962 (grapevine), ACJ36213 (Brassica rapa), XP_002302594 (P. trichocarpa), XP_002532702 and EEF49069 (R. communis), ACJ36213 (B. rapa), and AC122162_1.4 (M. truncatula) were aligned with ClustalW, and the nonrooted neighbor-joining tree was generated by the PAUP 4.0 program. Numbers at branch points indicate bootstrap support. (B) Time-dependent uptake of Cy3G into vacuolar vesicles prepared from yeast cells expressing MATE2 or empty vector. Substrate concentration was 100 μM. Results are means and sd of five replicate uptake assays after subtracting background. (C) Inhibition of Cy3G uptake (100 μM, 8-min incubation) by inhibitors of membrane transport. Results are means and sd of five replicate uptake assays after subtracting background. (D) Uptake of other flavonoid glycosides into MATE2-expressing membrane vesicles. Data show ATP-dependent uptake of each flavonoid glycoside or cyanidin (100 μM) by subtracting the −Mg-ATP control background. Flavonoids are as follows: epicatechin 3′-O-glucoside (E3′G), kaempferol 3-O-glucoside (K3G), kaempferol 7-O-glucoside (K7G), apigenin 7-O-glucoside (A7G), luteolin 7-O-glucoside (L7G), naringenin 7-O-glucoside (N7G), quercetin 3-O-glucoside (Q3G), quercetin 7-O-glucoside (Q7G), daidzein 7-O glucoside (D7G), genistein 7-O-glucoside (G7G), and pelargonidin 3-O-glucoside (P3G). (E) Competition by various flavonoids for uptake of Cy3G (50 μM) by MATE2. Cy3G uptake without competitor (3 nmol/mg protein over 8 min) was set as 100%. Relative Cy3G uptake in the presence of other flavonoids (250 μM) is shown after subtraction of background. Results are means and sd of three replicate uptake assays. Asterisks indicate statistically significant differences (** P < 0.01, * P < 0.05, paired t test) compared with corresponding controls (pYES vector control or 100% Cy3G uptake).
Figure 3.
Figure 3.
Expression Patterns of MATE2 and Malonyltransferases in M. truncatula. (A) Coexpression analysis of flavonoid biosynthetic genes with UGT78G1 and MATE2. Gene expression data from the GeneAtlas database (http://mtgea.noble.org/v2/) were log2 transformed, and hierarchical clustering was conducted based on Pearson correlation. Roots indicated by asterisks show the subclades of significant probability (>95%) calculated by Pvclust (Suzuki and Shimodaira, 2006). Gene names for probe sets are abbreviated as in Figure 1. A heat map mosaic representation of Pearson correlation values between each gene is shown in Supplemental Figure 4 online. (B) Tissue-level expression pattern of MATE2 in M. truncatula. Quantitative RT-PCR was conducted with mRNA samples from M. truncatula leaf (3–4 weeks old), root, stem (five to six internodes from top), vegetative bud, flower (2 d after opening of petals), and pod (6–12 d post-flowering). Amplified genes are shown. ACTIN was used as a control. Data are means and sd of triplicate experiments. (C) Quantitative RT-PCR confirmation of MATE2 expression in flowers (1–4 d after opening of petals) and leaves (1, 3, and 6 weeks old). Data are means and sd of triplicate experiments. (D) Cell type expression of MATE2 in young leaf and flower tissues as shown by in situ hybridization. (i) and (iii) show MATE2 expression in epidermal cells of sepals and petals at 3 and 2 d before flower opening, respectively. (v) and (vii) show MATE2 transcript signals in young leaf mesophyll cells. (ii), (iv), (vi), and (viii) are the corresponding sense controls. Bars = 70 μm.
Figure 4.
Figure 4.
Phylogeny and Activity of Medicago Malonyltransferases. (A) Phylogenetic tree of flavonoid acyltransferase proteins. The lengths of the lines indicate the relative distances between nodes on the nonrooted neighbor-joining tree. Numbers at branch points indicate bootstrap support. Proteins and their accession numbers are given in Methods. Putative acyltransferases Medtr3g150860, Medtr3g147460, Medtr3g147520, Medtr3g147590, Medtr2g102890, Medtr2g102840, and AC233655_10.1 were from M. truncatula IMGAG version MT3.0 (http://www.medicago.org/genome/downloads/Mt3/). (B) Purified recombinant MaT4, MaT5, and MaT6 malonyltransferase proteins separated by SDS-PAGE. The enzymes were expressed in E. coli as His-tagged fusions (~48 kD) and purified with nickel resin. (C) to (H) Analysis of MaT4 activity. (C) and (F) HPLC chromatographs showing substrates and products of malonyltransferase reactions catalyzed by recombinant MaT4 with A7G or K7G as substrate. Apigenin 7-O-glucoside malonate (A7GM) and kaempferol 7-O-glucoside malonate (K7GM) are indicated as products. (D) and (G) Mass spectra for A7G and K7G, respectively. (E) and (H) Mass spectra for the malonylated products A7GM and K7GM, respectively. (I) to (N) Analysis of MaT5 activity. (I) and (L) HPLC chromatographs showing substrates and products of malonyltransferase reactions catalyzed by recombinant MaT5 with Cy3G or P3G as substrate. Cyanidin 3-O-glucoside malonate (Cy3GM) and pelargonidin 3-O-glucoside malonate (P3GM) are indicated as products. (J) and (M) Mass spectra for Cy3G and P3G, respectively. (K) and (N) Mass spectra for the malonylated products Cy3GM and P3GM, respectively. Note that the exact position of malonylation remains to be determined.
Figure 5.
Figure 5.
Preferential Uptake of Malonylated Flavonoid Glucosides by Yeast Microsomal Vesicles Containing MATE2. (A) and (B) Time-dependent uptake of A7G and its malonylated product A7GM (A) or K7G and its product K7GM (B) into vacuolar vesicles prepared from yeast cells transformed with MATE2. Substrate concentration was 50 μM. Results are means and sd of three replicate uptake assays. (C) and (D) Time-dependent uptake of Cy3G and Cy3GM (C) or P3G and P3GM (D) from malonylation reactions into membrane vesicles from yeast cells expressing MATE2. The substrate concentrations in reaction mixtures were as follows: Cy3G, ~95 μM; Cy3GM, ~65 μM; P3G, ~102 μM; P3GM, ~75 μM. Results are means and sd of MATE2-mediated uptake, after subtracting vector controls, from three replicate uptake assays.
Figure 6.
Figure 6.
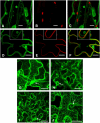
Subcellular Localization of MATE2, MaT4, MaT5, and MaT6. MATE2-GFP, GFP-MaT4, GFP-MaT5, and GFP-MaT6 were driven by the cauliflower mosaic virus 35S promoter and transiently expressed in tobacco leaf epidermal cells. Stable expression of MATE2-GFP in Arabidopsis was made by Agrobacterium-mediated transformation. Materials were viewed by confocal microscopy. (A) to (C) Fluorescence images of Arabidopsis petiole cells expressing MATE2-GFP. Bars = 25 μm. (A) GFP fluorescence image. (B) Chloroplast autofluorescence image. (C) Merged GFP image and chloroplast autofluorescence image. (D) to (F) Fluorescence images of Arabidopsis petiole cells expressing MATE2-GFP and stained with the dye FM4-64. Insets show enlarged images. Bars = 25 μm. (D) GFP fluorescence image. (E) FM4-64–labeled plasma membrane. (F) Merged image of (D) and (E). (G) to (J) Fluorescence images of tobacco leaf epidermal cells expressing free GFP, GFP-MaT4, GFP-MaT5, or GFP-MaT6. Arrows show the nucleus. The image shows 20 Z-series sections combined (5 μm thickness). Bars = 25 μm. (G) Fluorescence image of free GFP. (H) Fluorescence image of GFP-MaT4. (I) Fluorescence image of GFP-MaT5. (J) Fluorescence image of GFP-MaT6.
Figure 7.
Figure 7.
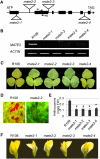
Loss-of-Function Analysis of MATE2 in M. truncatula. (A) The MATE2 gene and the positions of the Tnt1 retrotransposon insertions in mate2-1, mate2-2, mate2-3, and mate2-4. Introns (lines) and exons (black boxes) are shown. Positions of primers P1 and P2 designed for quantitative RT-PCR in the second exon are shown. (B) RT-PCR analysis of MATE2 transcripts in wild-type R108 and mate2 mutants. ACTIN was used as an internal control. Primers used here are to amplify full-length MATE2 cDNA. (C) Leaf pigmentation phenotypes of wild-type M. truncatula R108 and mate2 mutant lines (4 weeks old). (D) Anthocyanin pigments in leaf mesophyll cells of the mate2 mutant and wild-type M. truncatula R108 (4 weeks old). (E) Anthocyanin levels in 2-week-old seedlings of mate2 mutants and wild-type R108. Values are means and sd from three biological replicates. Asterisks indicate that the flavonoid levels in mate2 mutants are statistically different (P < 0.05, two-paired t test) from those in the corresponding wild-type plants. FW, fresh weight. (F) Flower color phenotypes of wild-type M. truncatula R108 and mate2 mutant lines 2 d post opening of petals.
Figure 8.
Figure 8.
Flavonoid Profiles in M. truncatula mate2 Mutants and their Null Segregant Controls. Leaves from 4-week old seedlings and flowers 2 to 3 d post flowering were harvested from mate2 mutants and wild-type plants for metabolite analysis by UPLC-ESI-TOF-MS. Mature seeds of mate2 (mate2 Ho) and null segregant controls (mate2 WT) were analyzed for PA levels. Data are means and sd from three biological replicates. Asterisks indicate that the flavonoid levels in mate2 mutants are statistically different (P < 0.05, Student’s t test) from those in the corresponding wild-type plants. (A) Top, profiles of flavonoids in mate2 mutants and null segregant controls; bottom, profiles of flavonoid malonates in mate2 mutants and null segregant controls. DW, dry weight. (B) Contents of soluble and insoluble PAs in mate2 mutants and null segregant controls.

Similar articles

Cited by

References

    1. Ariga T., Asao Y., Sugimoto H., Yokotuska T. (1981). Occurrence of astringent oligomeric proanthocyanidins in legume seeds. Agric. Biol. Chem. 45: 2705–2708
    1. Bartholomew D.M., Van Dyk D.E., Lau S.M., O’Keefe D.P., Rea P.A., Viitanen P.V. (2002). Alternate energy-dependent pathways for the vacuolar uptake of glucose and glutathione conjugates. Plant Physiol. 130: 1562–1572 - PMC - PubMed
    1. Benedito V.A., et al. (2008). A gene expression atlas of the model legume Medicago truncatula. Plant J. 55: 504–513 - PubMed
    1. Boller T., Wiemken A. (1986). Dynamics of vacuolar compartmentation. Annu. Rev. Plant Physiol. 37: 137–164
    1. Buer C.S., Muday G.K., Djordjevic M.A. (2007). Flavonoids are differentially taken up and transported long distances in Arabidopsis. Plant Physiol. 145: 478–490 - PMC - PubMed

Publication types

MeSH terms

LinkOut - more resources