Comparative Study
. 2011 Apr;23(4):1249-63.
doi: 10.1105/tpc.110.082537. Epub 2011 Apr 5.

Unlocking the barley genome by chromosomal and comparative genomics

Affiliations
Comparative Study

Unlocking the barley genome by chromosomal and comparative genomics

Klaus F X Mayer et al. Plant Cell. 2011 Apr.

Abstract

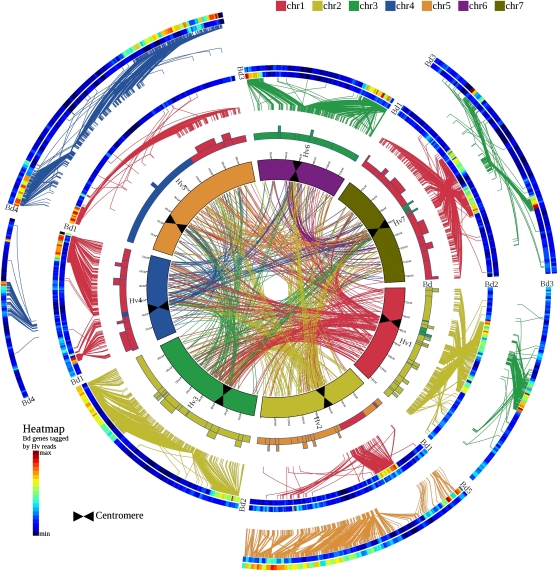
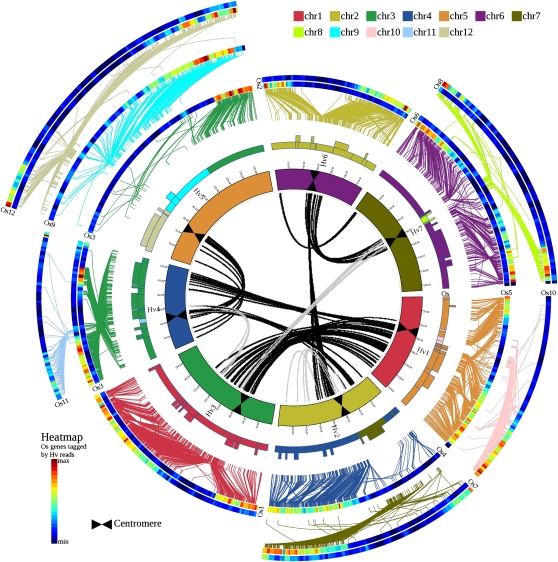
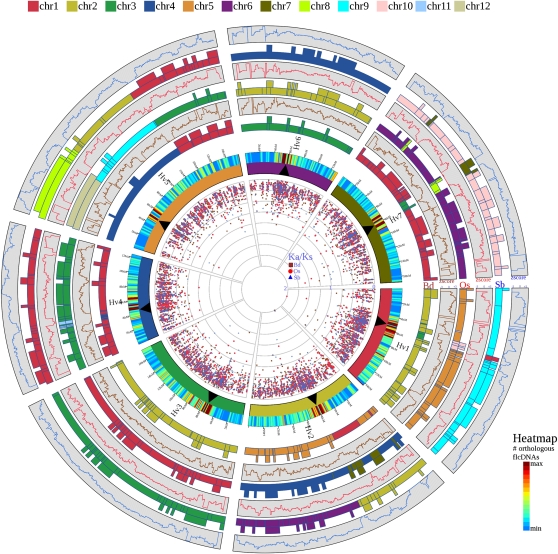
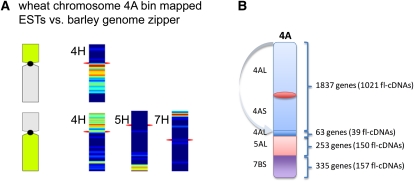
We used a novel approach that incorporated chromosome sorting, next-generation sequencing, array hybridization, and systematic exploitation of conserved synteny with model grasses to assign ~86% of the estimated ~32,000 barley (Hordeum vulgare) genes to individual chromosome arms. Using a series of bioinformatically constructed genome zippers that integrate gene indices of rice (Oryza sativa), sorghum (Sorghum bicolor), and Brachypodium distachyon in a conserved synteny model, we were able to assemble 21,766 barley genes in a putative linear order. We show that the barley (H) genome displays a mosaic of structural similarity to hexaploid bread wheat (Triticum aestivum) A, B, and D subgenomes and that orthologous genes in different grasses exhibit signatures of positive selection in different lineages. We present an ordered, information-rich scaffold of the barley genome that provides a valuable and robust framework for the development of novel strategies in cereal breeding.


Figures

Figure 1.
Figure 1.
High-Resolution Comparative Analysis between Barley and B. distachyon. High-density comparative analysis of the linear gene order of the barley genome zippers versus the sequenced model grass genome of Brachypodium. The figure includes four sets of concentric circles: the inner circle represents the seven chromosomes of barley scaled according to the barley genetic map (bars at 10-cM intervals). Each barley chromosome is assigned a color according to the sequence on the color key, starting with chr1 through chr7. The positions of the barley centromeres are indicated by black bars. Moving outwards, the second circle illustrates a schematic model of the seven barley chromosomes, but this time color-coded according to blocks of conserved synteny with the model genome. The color coding is again based on the sequence on the color key, but this time is based on the model genome linkage groups, starting with chr1 through chr5 for Brachypodium. Boxes extending from these colored bars indicate regions involved in larger-scale structural changes (e.g., inversions). The outer partially complete circles of heat map colored bars represent pseudomolecules of the model genome linkage groups arranged according to conserved synteny with barley 1H-7H. When pairs of adjacent heat map bars are shown, they illustrate where the homologs of a short (inner heat map bar) or a long (outer heat map bar) barley chromosome arm data set is allocated to the respective model genome pseudochromosome. The heat maps illustrate the density of genes hit by the 454 shotgun reads from the relevant barley chromosome arm. Conserved syntenic regions are highlighted by yellow-red–colored regions. Putative orthologs between barley and the model genomes are connected with lines (colored according to model genome chromosomes) between the second and third circles. Colored lines in the center represent putative paralogous relationships between barley chromosomes on the basis of fl-cDNA supported genes included in the genome zipper models of the seven barley chromosomes.
Figure 2.
Figure 2.
High-Resolution Comparative Analysis between Barley and Rice. High-density comparative analysis of the linear gene order of the barley genome zippers versus the sequenced model grass genome of rice. Details are as provided in the Figure 1 legend. Putative orthologs between barley and the rice genomes are connected with lines (colored according to model genome chromosomes) between second, third, and fourth circles. In the center, nine major segmental duplications of the barley genome are visualized as statistically significant groups of paralogous genes. Each line represents a duplicated gene (paralogous gene pair). Black lines indicate ancestral duplications shared with the model grass genomes, and gray lines highlight barley-specific duplications.
Figure 3.
Figure 3.
Barley-Centered Four-Genome Comparative View of Grass Genome Collinearity. The seven barley chromosomes (Hv1 to Hv7) are depicted by the inner circle of colored bars exactly as in Figure 1. The heat map attached to each chromosome indicates the density of barley fl-cDNAs anchored and positioned along the chromosomes according to the genome zipper models. Gene density is colored according to the heat map scale. Moving outwards, the bars represent a schematic diagram of the barley chromosomes colored according to conserved synteny with the genomes of Brachypodium (Bd), rice (Os), and sorghum (Sb), respectively. In each case, the chromosome numbers and segments are colored according to the chromosome color code (i.e., chr1 through chr5 for Bd, chr1 through chr12 for Os, and chr1 through chr10 for Sb). As in Figure 1, boxes extending from the colored bars indicate structural changes (e.g., inversions) between the gene order in barley and the respective model genome. To the outside of each model genome chromosome, box graphs show the z-score derived from a sliding window analysis of the frequency of fl-cDNAs present at a conserved syntenic position with their corresponding orthologs in Bd, Os, and Sb, respectively (see Methods for a full description of the analysis). A z-score >0 indicates higher than the average conservation of synteny, and a z-score <0 highlights decreased syntenic conservation. The data points in the center of the diagram depict the Ka/Ks ratios between barley full-length genes and their orthologs in Bd, Os, and Sb. Values against Bd are plotted as dark red rectangles, against Os in red circles, and against Sb in blue triangles.
Figure 4.
Figure 4.
Structure of Wheat Chromosome 4A in Relation to the Barley Genome Zipper. Wheat subgenome specific markers of chromosome 4A have been compared against the genome zipper chromosome model of barley (for a genome-wide overview, see Supplemental Figure 5 online). Orthologous regions are depicted and visualized by a heatmap. (A) Wheat EST markers allocated to 4AS cross-match to barley genes on 4HL and markers allocated to 4AS, a small region on 4AL, 5AL, and 7BS cross-match to 4HL. Thus, a reciprocal translocation involving chromosomes 4A and 5A and a translocation from 7BS to 4AL was detected. Compared with barley 4H, wheat chromosome 4A contains a pericentromeric inversion. (B) The barley genome zipper model allows the size of the affected regions to be estimated and the minimal number of genes located in these rearranged regions of the wheat chromosomes to be predicted.

Similar articles

Cited by

References

    1. Abrouk M., Murat F., Pont C., Messing J., Jackson S., Faraut T., Tannier E., Plomion C., Cooke R., Feuillet C., Salse J. (2010). Palaeogenomics of plants: Synteny-based modelling of extinct ancestors. Trends Plant Sci. 15: 479–487 - PubMed
    1. Agalou A., et al. (2008). A genome-wide survey of HD-Zip genes in rice and analysis of drought-responsive family members. Plant Mol. Biol. 66: 87–103 - PubMed
    1. Altschul S.F., Gish W., Miller W., Myers E.W., Lipman D.J. (1990). Basic local alignment search tool. J. Mol. Biol. 215: 403–410 - PubMed
    1. Beales J., Turner A., Griffiths S., Snape J.W., Laurie D.A. (2007). A pseudo-response regulator is misexpressed in the photoperiod insensitive Ppd-D1a mutant of wheat (Triticum aestivum L.). Theor. Appl. Genet. 115: 721–733 - PubMed
    1. Benjamini Y., Hochberg Y. (1995). Controlling the false discovery rate: A practical and powerful approach to multiple testing. J. R. Stat. Soc. B 57: 289–300

Publication types

LinkOut - more resources