. 2011 Jun;25(6):1026-35.
doi: 10.1038/leu.2011.53. Epub 2011 Apr 5.

Clinical and biological implications of MYC activation: a common difference between MGUS and newly diagnosed multiple myeloma

Affiliations

Clinical and biological implications of MYC activation: a common difference between MGUS and newly diagnosed multiple myeloma

W-J Chng et al. Leukemia. 2011 Jun.

Abstract

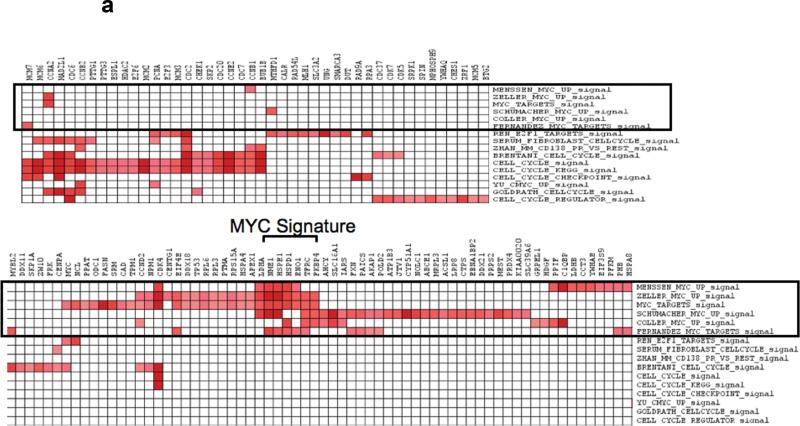
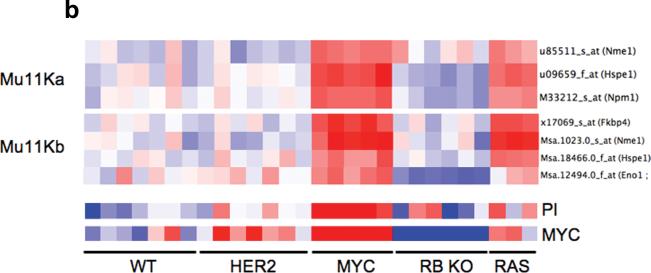
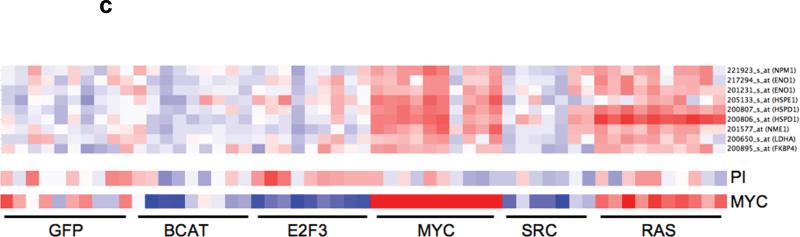
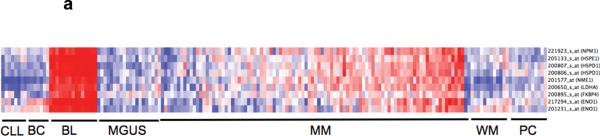
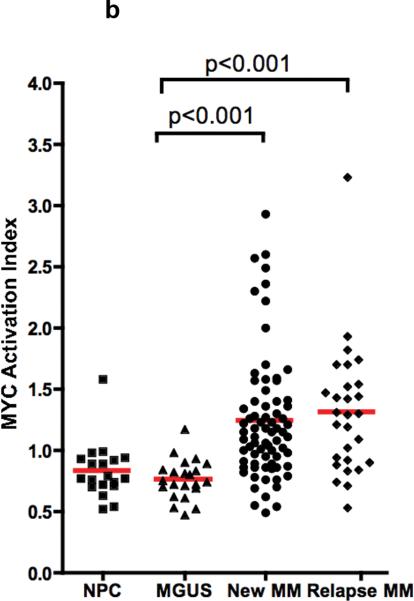
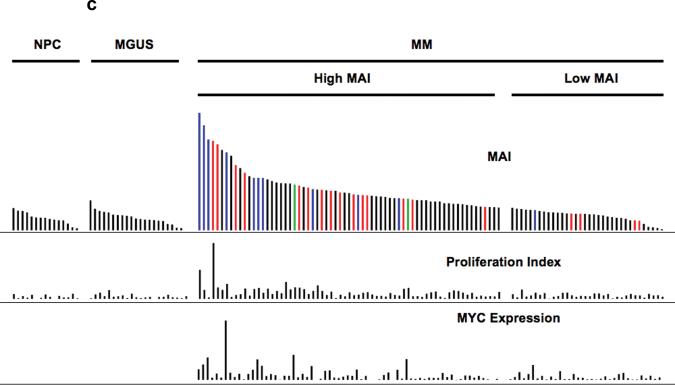
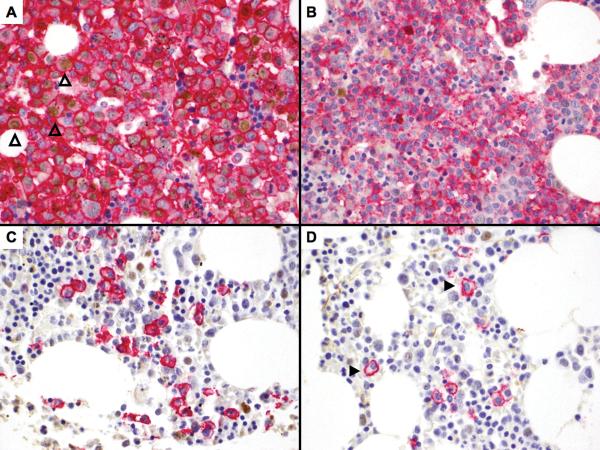
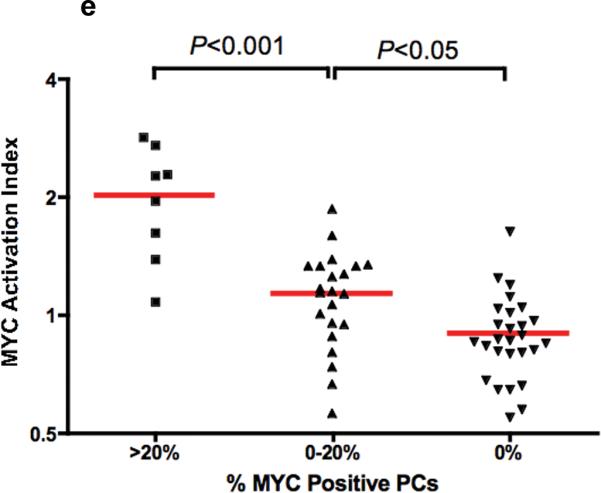
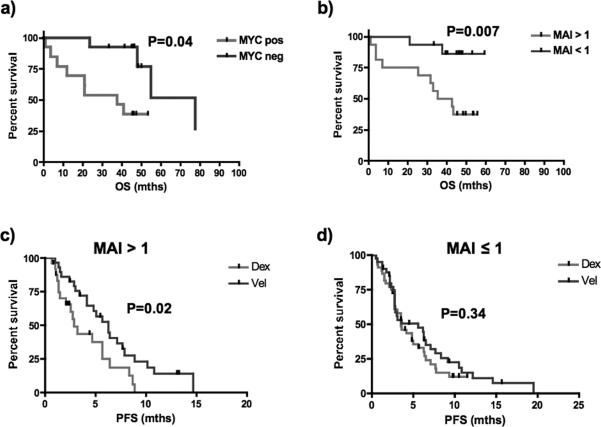
Events mediating transformation from the pre-malignant monoclonal gammopathy of undetermined significance (MGUS) to multiple myeloma (MM) are unknown. We analyzed gene expression data sets generated on the Affymetrix U133 platform from 22 MGUS and 101 MM patients using gene-set enrichment analysis. Genes overexpressed in MM were enriched for cell cycle, proliferation and MYC activation gene sets. Upon dissecting the relationship between MYC and cell-cycle gene sets, we identified and validated an MYC activation signature dissociated from proliferation. Applying this signature, MYC is activated in 67% of myeloma, but not in MGUS. This was further confirmed by immunohistochemistry (IHC) using membrane CD138 and nuclear MYC double staining. We also showed that almost all tumors with RAS mutations expressed the MYC activation signature, and multiple mechanisms may be involved in activating MYC. MYC activation, whether assessed by gene-expression signature or IHC, is associated with hyperdiploid MM and shorter survival even in tumors that are not proliferative. Bortezomib treatment is able to overcome the survival disadvantage in patients with MYC activation.


Figures

Figure 1
Figure 1. Derivation and Validation of MYC signature dissociated from cell cycle
(a) Leading edge analysis of enriched MYC and cell cycle genesets identified a set of genes which are consistently enriched (red squares) across the different MYC genesets (in black box) that are not enriched in the cell cycle genesets. This set of genes constitutes our MYC signature that is dissociated from cell cycle and proliferation. In the grid, the columns represent genes that constitute the main enrichments (leading edge genes) in the different genesets (row). We then validated this signature in a (b) mouse fibroblast and (c) human mammary cell line gene expression dataset. In the heatmaps, each row represents a gene and each column a sample. Red represents upregulation and blue downregulation of the respective genes.
Figure 2
Figure 2. Expression of MYC activation signature in MM and not MGUS
(a) The derived MYC signature is highly expressed in Burkitt's lymphoma and also expressed in a substantial number of MM but not MGUS. (b) When the MYC activation signature is summarized as the MYC Activation Index (MAI), based on median expression of genes constituting the signature, it is significantly higher in both newly diagnosed and relapsed MM compared to MGUS and normal plasma cells (NPC). The MAI is similar in both new and relapse MM. (c) The samples are arranged according to the MAI. Each row represents a different parameter, with MAI followed by proliferation index, and MYC mRNA expression. In the MAI row, the colored bars represent samples with RAS mutations (red), ‘spiked’ MYC expression (5 fold or greater expression than median) and both RAS mutations and ‘spiked’ MYC expression (green). It is clear that RAS mutations and ‘spiked’ MYC expression (resulting from IgH-MYC translocations) are generally mutually exclusive. Amongst the MM with high MAI, some of them have low proliferation (PI) or low expression of MYC itself or both.
Figure 3
Figure 3. Core Signatures correlated with MYC activation signature
(a) In the Mayo MM dataset, enrichment for MYC, Cell cycle, proteasome, tRNA and metabolic genesets are highly correlated whereas the IFN pathway genesets are enriched in a subset of MM without MYC activation. (b) In the P493-6 cell line model where MYC expression can be manipulated and graduated. Similar patterns among these pathways are seen. In addition, increasing MYC expression and activation also lead to suppression of NFKB signature extracted from 2 recent studies designated as NFKB_9 and NFKB_New .
Figure 4
Figure 4. Expression of MYC is present in CD138 positive plasma cells in MM but not MGUS by IHC, and increase with increasing MAI
These bone marrow sections are double-stained with CD138 (red - membrane) and MYC (brown -nuclear). (A) MM with high CD138 infiltration showing positivity for nuclear MYC expression in CD138 positive cells (3 examples indicated by open arrowheads). However, there are MM cases with both (B) high or (C) low CD138 plasma cell infiltration that are negative for MYC. (D) CD138 positive plasma cells in MGUS are universally negative for nuclear MYC (2 examples indicated by closed arrowheads). (e) The MAI increase significantly across the categories of increasing percentage of MYC positive plasma cells.
Figure 5
Figure 5. Survival according to the MAI and MYC staining by IHC
(a) When only newly diagnosed tumors with PCLI<1 are analyzed, those with no MYC staining (n=13) still have significantly longer survival than those with MYC staining (n=13) (median survival 77.7 mths versus 37.9 months, log-rank p-value = 0.04). (b) Overall survival is significantly shorter in newly diagnosed MM patients with high MAI compared to those with low index even when only patients with low proliferation are considered (median survival 39.2 mths versus not yet reached; log-rank p-value 0.007). (c) In patients entered into a randomized study of bortezomib versus dexamethasone, those with MAI > 1 have significantly better PFS when treated with bortezomib compared to dexamethasone (6.3 months (n=37) compared to 2.9 months (n=28), log-rank p-value = 0.02). (d) In contrast, for those patients with MAI ≤ 1, there is no difference in PFS with either treatment (5.6 months (n=43) versus 3.5 months (n=48), log-rank p-value = 0.34).

References

    1. Weiss BM, Abadie J, Verma P, Howard RS, Kuehl WM. A monoclonal gammopathy precedes multiple myeloma in most patients. Blood. 2009;113:5418–5422. - PMC - PubMed
    1. Landgren O, Kyle RA, Pfeiffer RM, Katzmann JA, Caporaso NE, Hayes RB, et al. Monoclonal gammopathy of undetermined significance (MGUS) consistently precedes multiple myeloma: a prospective study. Blood. 2009;113:5412–5417. - PMC - PubMed
    1. Chng WJ, Glebov O, Bergsagel PL, Kuehl WM. Genetic events in the pathogenesis of multiple myeloma. Best Pract Res Clin Haematol. 2007;20:571–596. - PMC - PubMed
    1. Chng WJ, Van Wier SA, Ahmann GJ, Winkler JM, Jalal SM, Bergsagel PL, et al. A validated FISH trisomy index demonstrates the hyperdiploid and nonhyperdiploid dichotomy in MGUS. Blood. 2005;106:2156–2161. - PMC - PubMed
    1. Fonseca R, Bailey RJ, Ahmann GJ, Rajkumar SV, Hoyer JD, Lust JA, et al. Genomic abnormalities in monoclonal gammopathy of undetermined significance. Blood. 2002;100:1417–1424. - PubMed

Publication types

MeSH terms